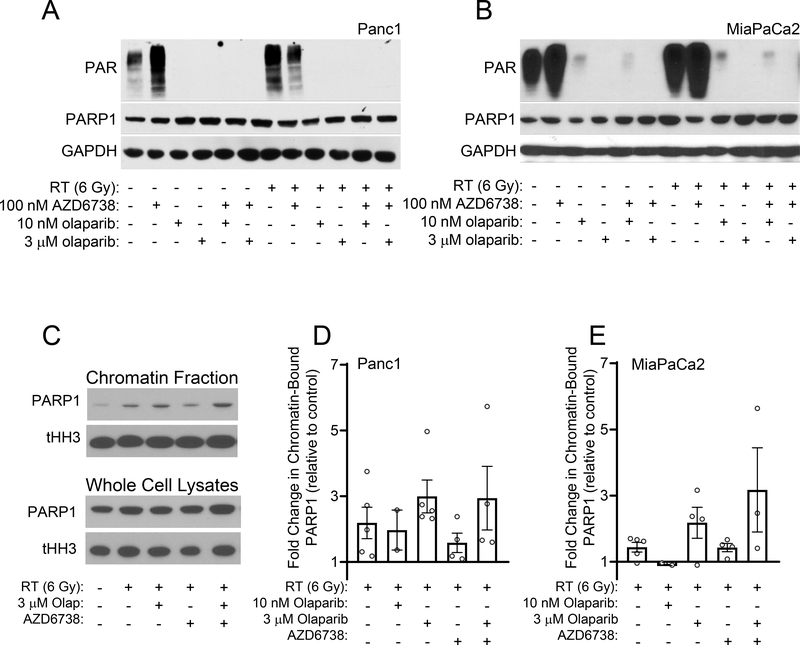
Figure 3. The effects of olaparib and AZD6738 on PARP catalytic inhibition and PARP1-DNA binding.
MiaPaCa2 and Panc1 cells were treated with either 10 nM or 3 μM olaparib and 100 nM AZD6738 beginning 1 hour pre- and continuing 24 hours post-RT (6 Gy). At the end of drug treatment, cells were analyzed by immunoblotting for the indicated proteins. Images from representative experiments are shown (A, B). Representative images of PARP1 in chromatin fractions or whole-cell lysates from Panc1 cells prepared 24 hours post-RT and analyzed by immunoblotting (C). Quantification of the fold change in chromatin-bound PARP1 relative to control, untreated cells. Data bars are the mean ± SE of n, 2–5 independent experiments. Individual data measurements are also shown (D, E).

