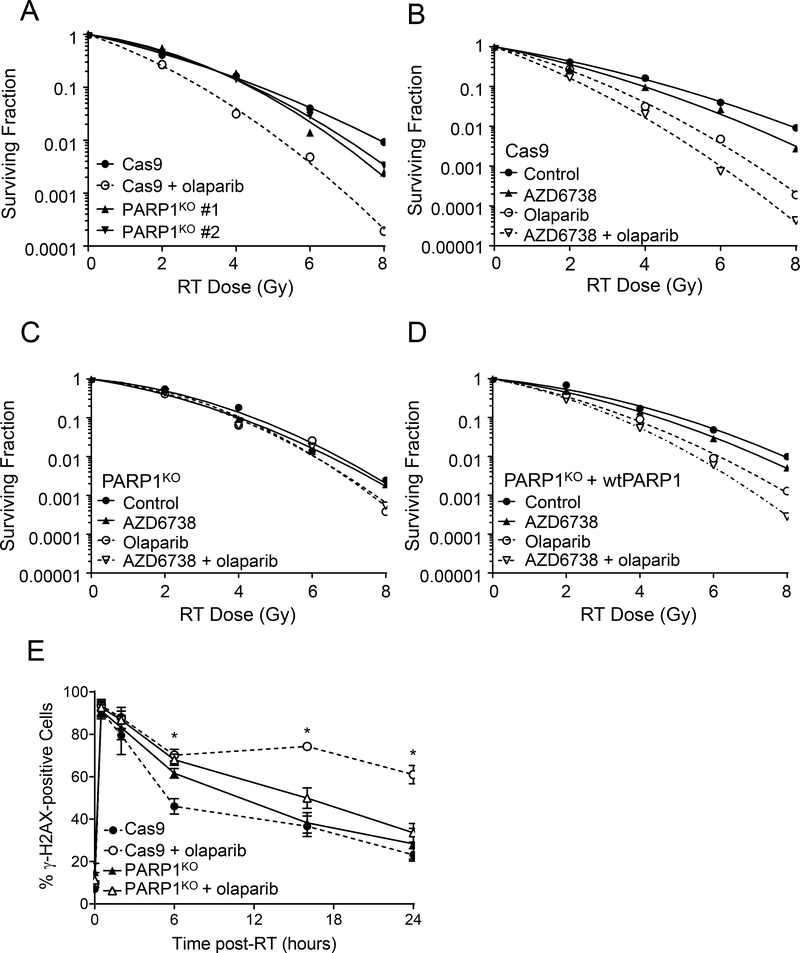
Figure 4. PARP1 protein is required for olaparib-mediated radiosensitization and DNA damage signaling.
Representative radiation survival curves for irradiated MiaPaCa2 Cas9 control cells (A, B), PARP1KO cells (A, C) or PARP1KO + wtPARP1 cells (D) treated with 3 μM olaparib and/or 100 nM AZD6738. For mean radiation enhancement ratios, survival data and statistical analysis, see Table 1B. To assess DNA damage signaling, irradiated cells treated ± olaparib were collected 0.5, 2, 6, 16, or 24 hours post-RT and assayed for γH2AX staining by flow cytometry (E). Data plotted are either the mean ± SD of n, 2 independent experiments (30 min post-RT) or the mean ± SE of n, 3–4 independent experiments. Statistical significance for Cas9 cells treated with radiation + olaparib versus radiation alone is indicated (*P <0.05, unpaired t test).

