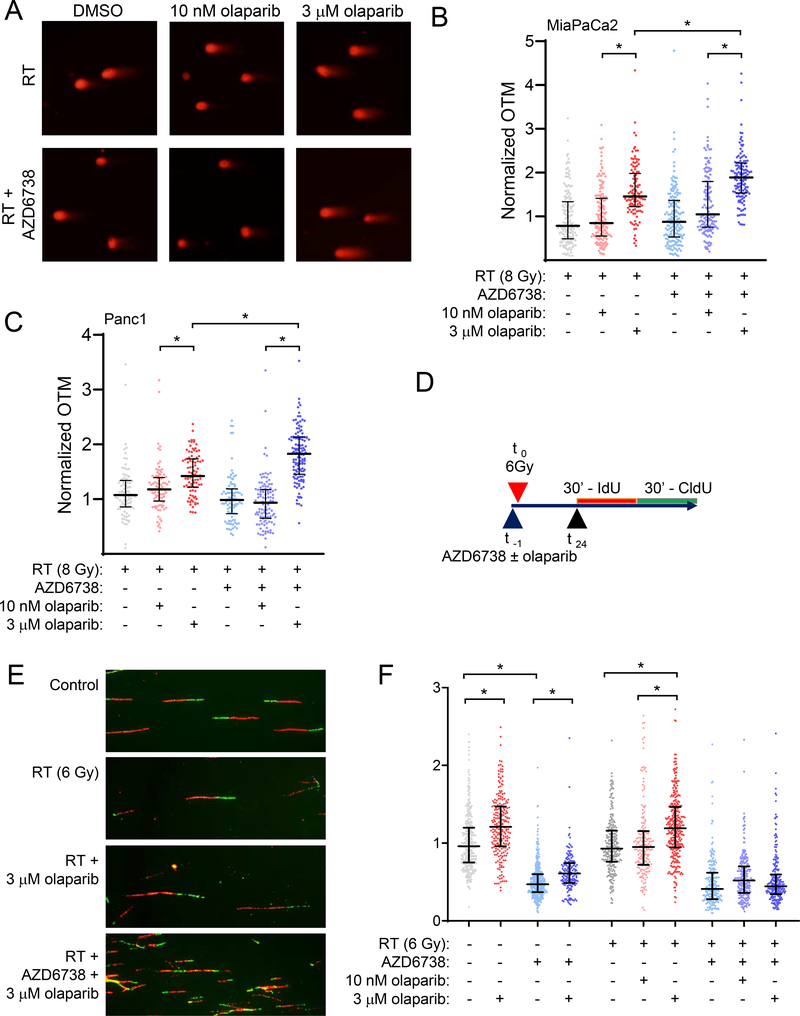
Figure 5. Olaparib-mediated DNA damage and replication stress are concentration dependent.
MiaPaCa2 and Panc1 cells were treated with 100 nM AZD6738 and/or olaparib beginning one hour pre- and continuing 24 hours post-RT (8 Gy). At the end of drug treatment, DSBs were measured by neutral comet assay. Representative images of nuclei from MiaPaCa2 treated as indicated (A). Olive tail moment (OTM) measurements were normalized to an internal control of cells collected immediately post-RT. Error bars represent the median normalized OTM ± interquartile range from a single, representative experiment with individual measurements shown (B, C). Schedule for drug treatment and labeling of DNA fiber samples (D). Representative DNA fiber images from MiaPaCa2 cells treated as indicated (E). The effects of AZD6738 and olaparib on DNA replication rate (F). Replication fork speed was calculated for individual forks labelled with an IdU track (red) flanked by a single CldU track (green). Errors bars represent the median fork speed ± interquartile range of data pooled from 2 independent experiments. Scored forks: control = 354; 3 μM olaparib = 227; AZD6738 = 349; 3 μM olaparib + AZD6738 = 162; 6 Gy = 242; RT + 10 nM olaparib = 177; RT + 3 μM olaparib = 309; RT + AZD6738 = 201; RT + 10 nM olaparib + AZD6738 = 238; RT + 3 μM olaparib + AZD6738 = 163. Statistical significance between distributions was determined with the nonparametric Kruskal-Wallis test (P < 0.05) (B, C, F).

