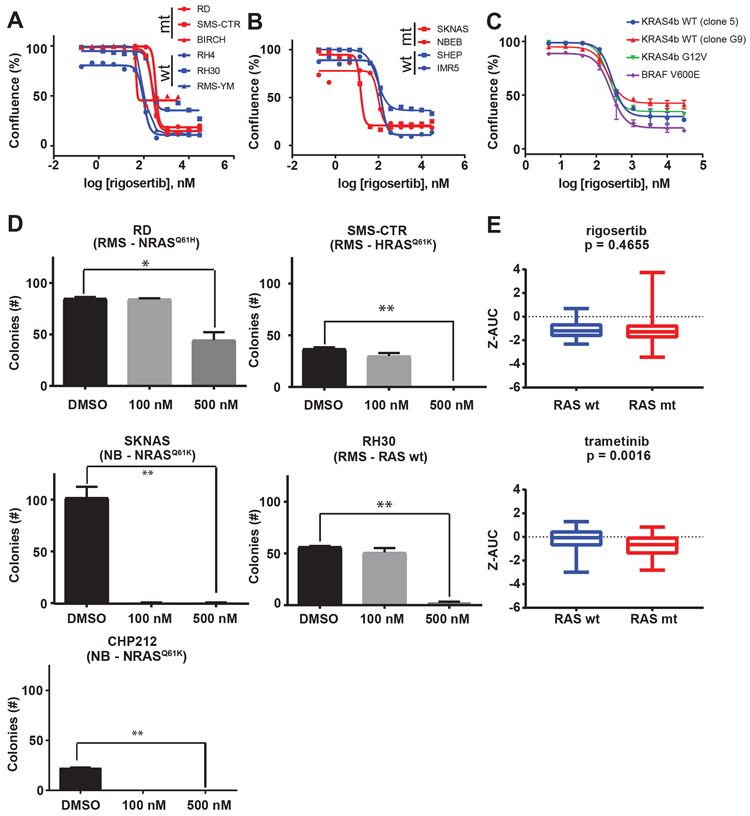
Figure 1: Rigosertib decreases cell viability in rhabdomyosarcoma and neuroblastoma cell lines.
(A) Efficacy of rigosertib was determined in rhabdomyosarcoma cell lines using percent confluence 72 hours after treatment with rigosertib as a marker of viability. Percent confluence was determined by live cell imaging (Incucyte ZOOM). Points represent the mean and error bars show the standard error of the mean of triplicate measurements. Curves in red are cell lines with mutant NRAS (RD) or HRAS (SMS-CTR, BIRCH). Curves in blue are cell lines expressing wild-type RAS isoforms (RH4, RH30, RMS-YM). (B) Efficacy of rigosertib was determined in neuroblastoma cell lines using percent confluence 96 hours after treatment with rigosertib as a marker of viability. Curves in red are cell lines expressing mutant NRAS (SKNAS) or KRAS (NBEB). Curves in blue are cell lines expressing wild-type RAS isoforms (SHEP, IMR5). (C) Efficacy of rigosertib was determined in a panel of isogeneic RAS-dependent MEFs. In this experiment, percent confluence 72 hours after treatment with rigosertib was used as a marker of viability. (D) Quantification of 14-day clonogenic assays for RD, SMS-CTR, SKNAS, CHP212, and RH30 growth in the presence of rigosertib. * denotes p <0.05, ** denotes p <0.001 as determined by Student’s t-test. (E) Relative potency of rigosertib (top) and the MEK inhibitor trametinib (bottom) as represented by the z-score of the area under the dose-response curve (AUC) in a panel of cell lines screened as part of a collaboration between NCI and NCATS for RAS wild-type and RAS-mutant cells. P-values determined by Mann-Whitney test.

