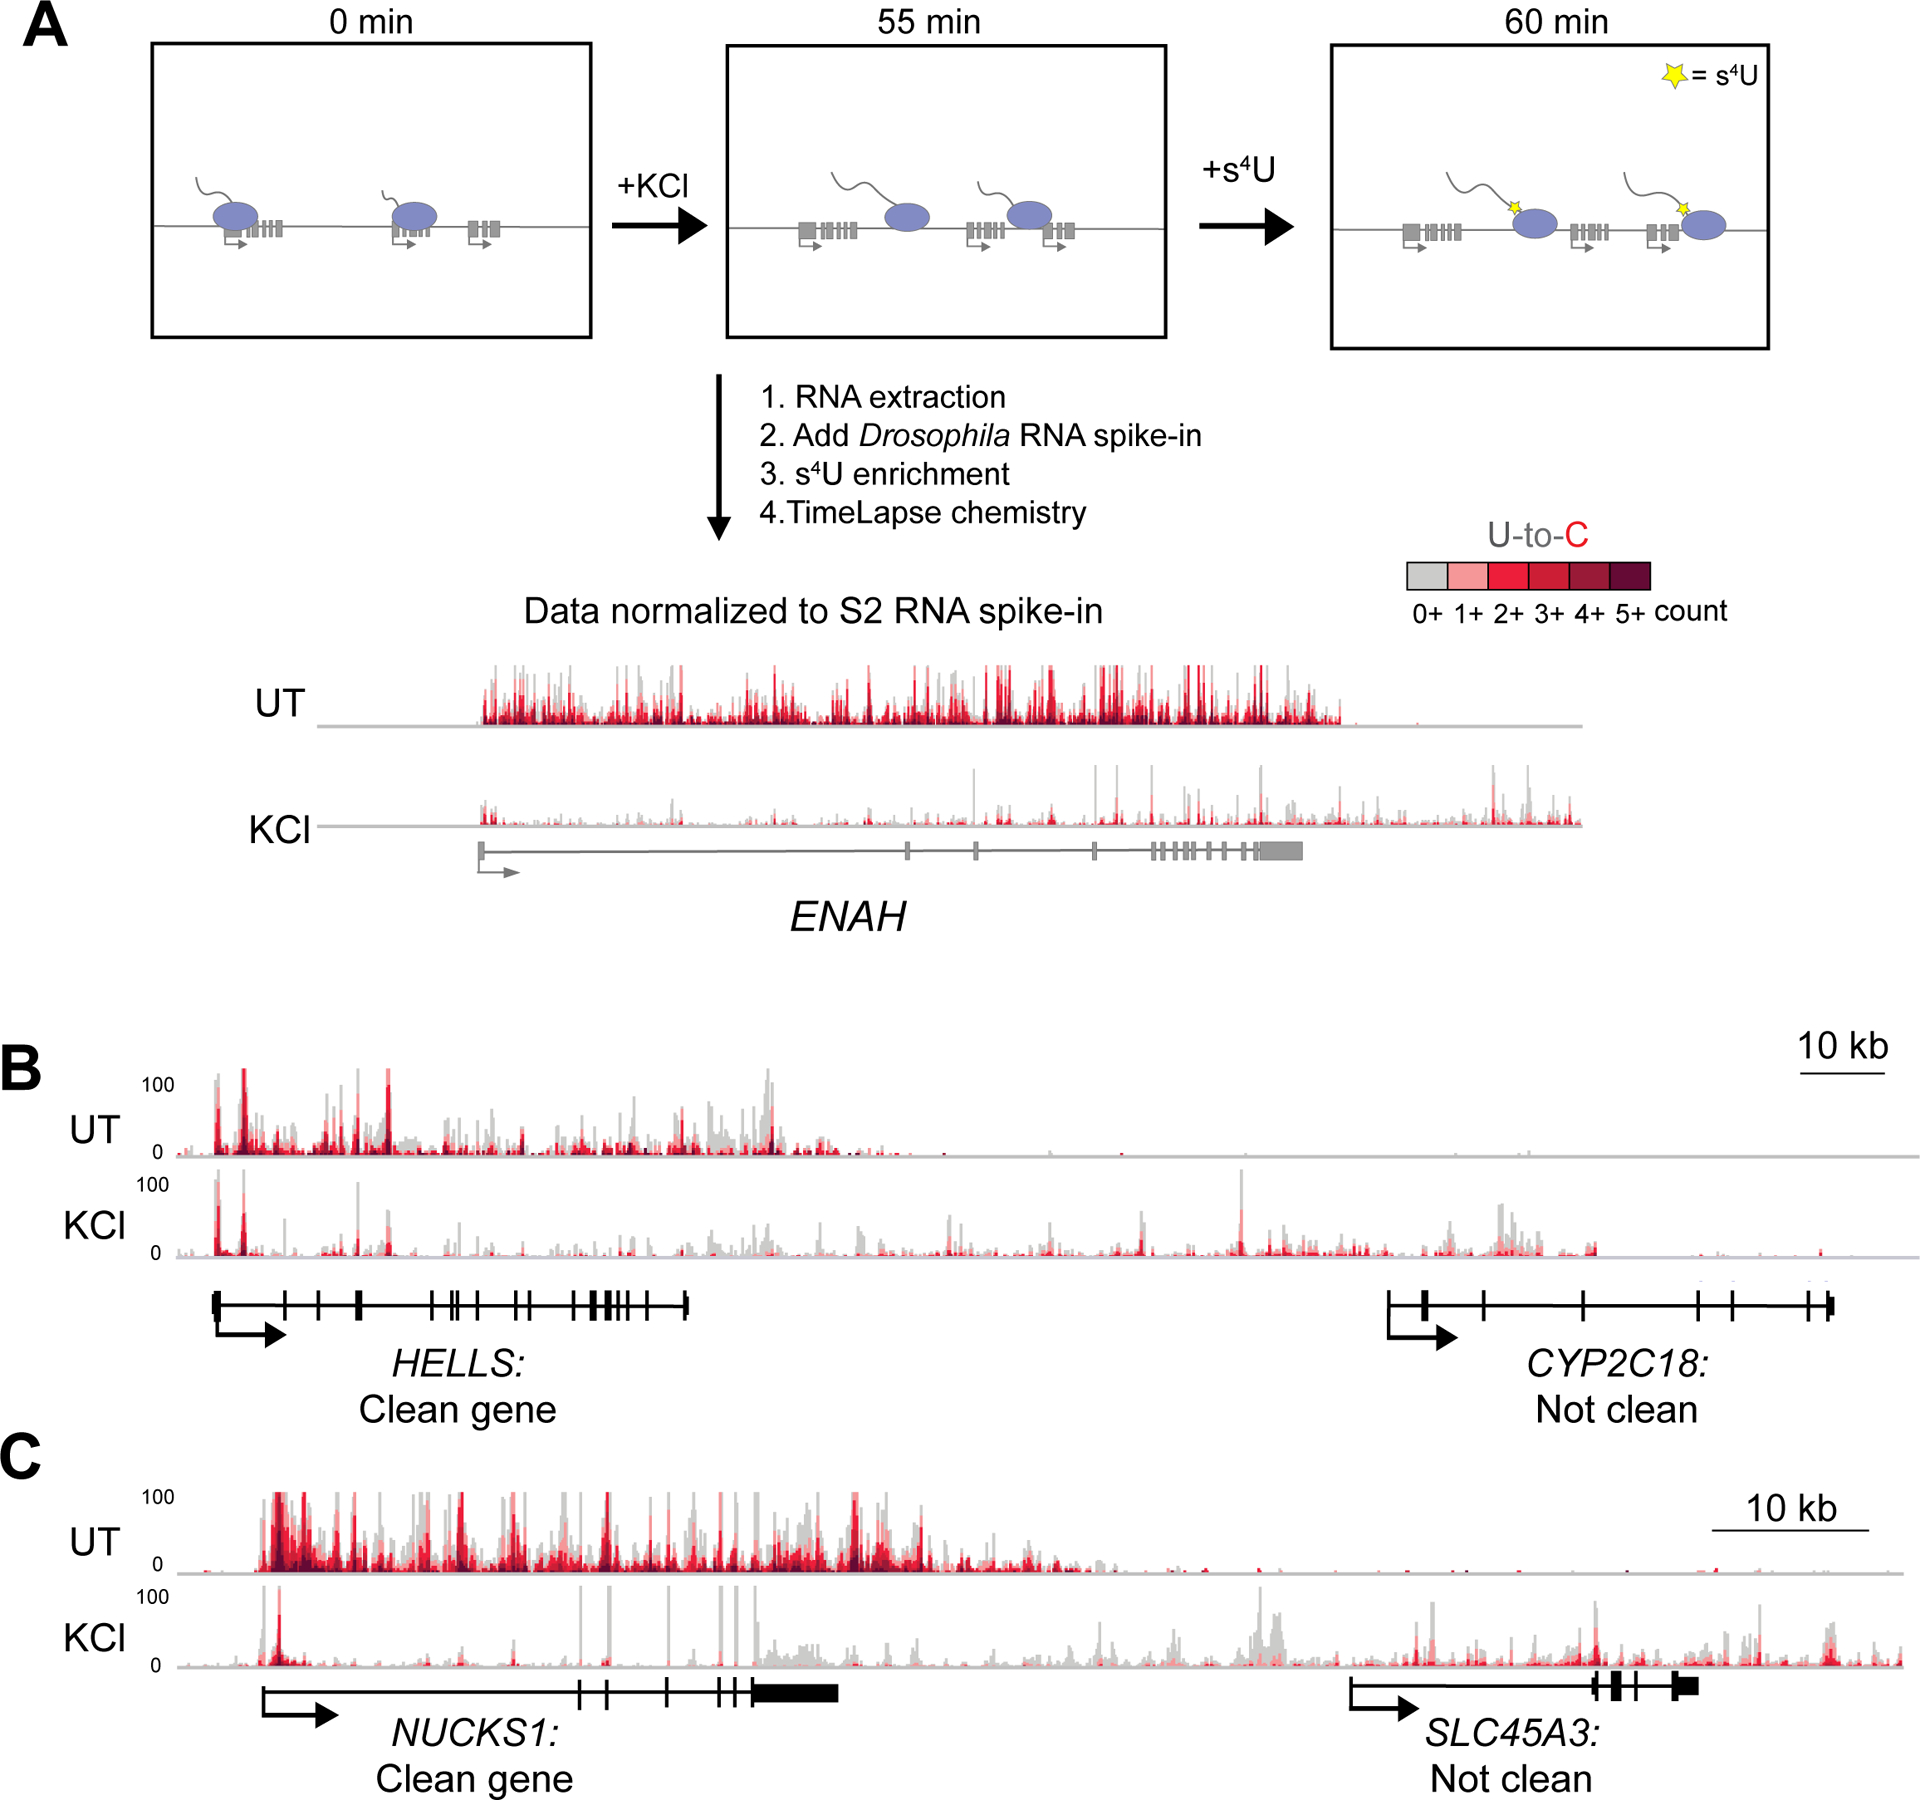
Figure 1:

TT-TL-seq reveals transcriptional profiles that accompany DoG induction after hyperosmotic stress. A) Setup for TT-TimeLapse sequencing (TT-TL-seq) experiments in HEK-293T cells. An arrow indicating directionality marks the beginning of each transcription unit. Exons are shown as rectangles and Pol II molecules are light purple ovals with attached nascent RNAs. Genome browser views of TT-TL-seq data for ENAH provide an example of results from untreated (UT) and KCl-treated (KCl) cells after normalization to the spike-in control. B) Browser image of TT-TL-seq data exemplifying a clean gene (HELLS) and a gene that does not meet the criteria for a clean gene (CYP2C18). The DoG produced from HELLS reads into CYP2C18, making the latter appear to be transcriptionally activated by hyperosmotic stress (log2 FC=5.39). C) The DoG produced from NUCKS1 is assigned to SLC45A3 because of extensive read-in transcription, which also complicates accurate differential expression analysis for SLC45A3 (log2 FC=4.13). ~4–5 kb upstream of HELLS and NUCKS1 are shown.
