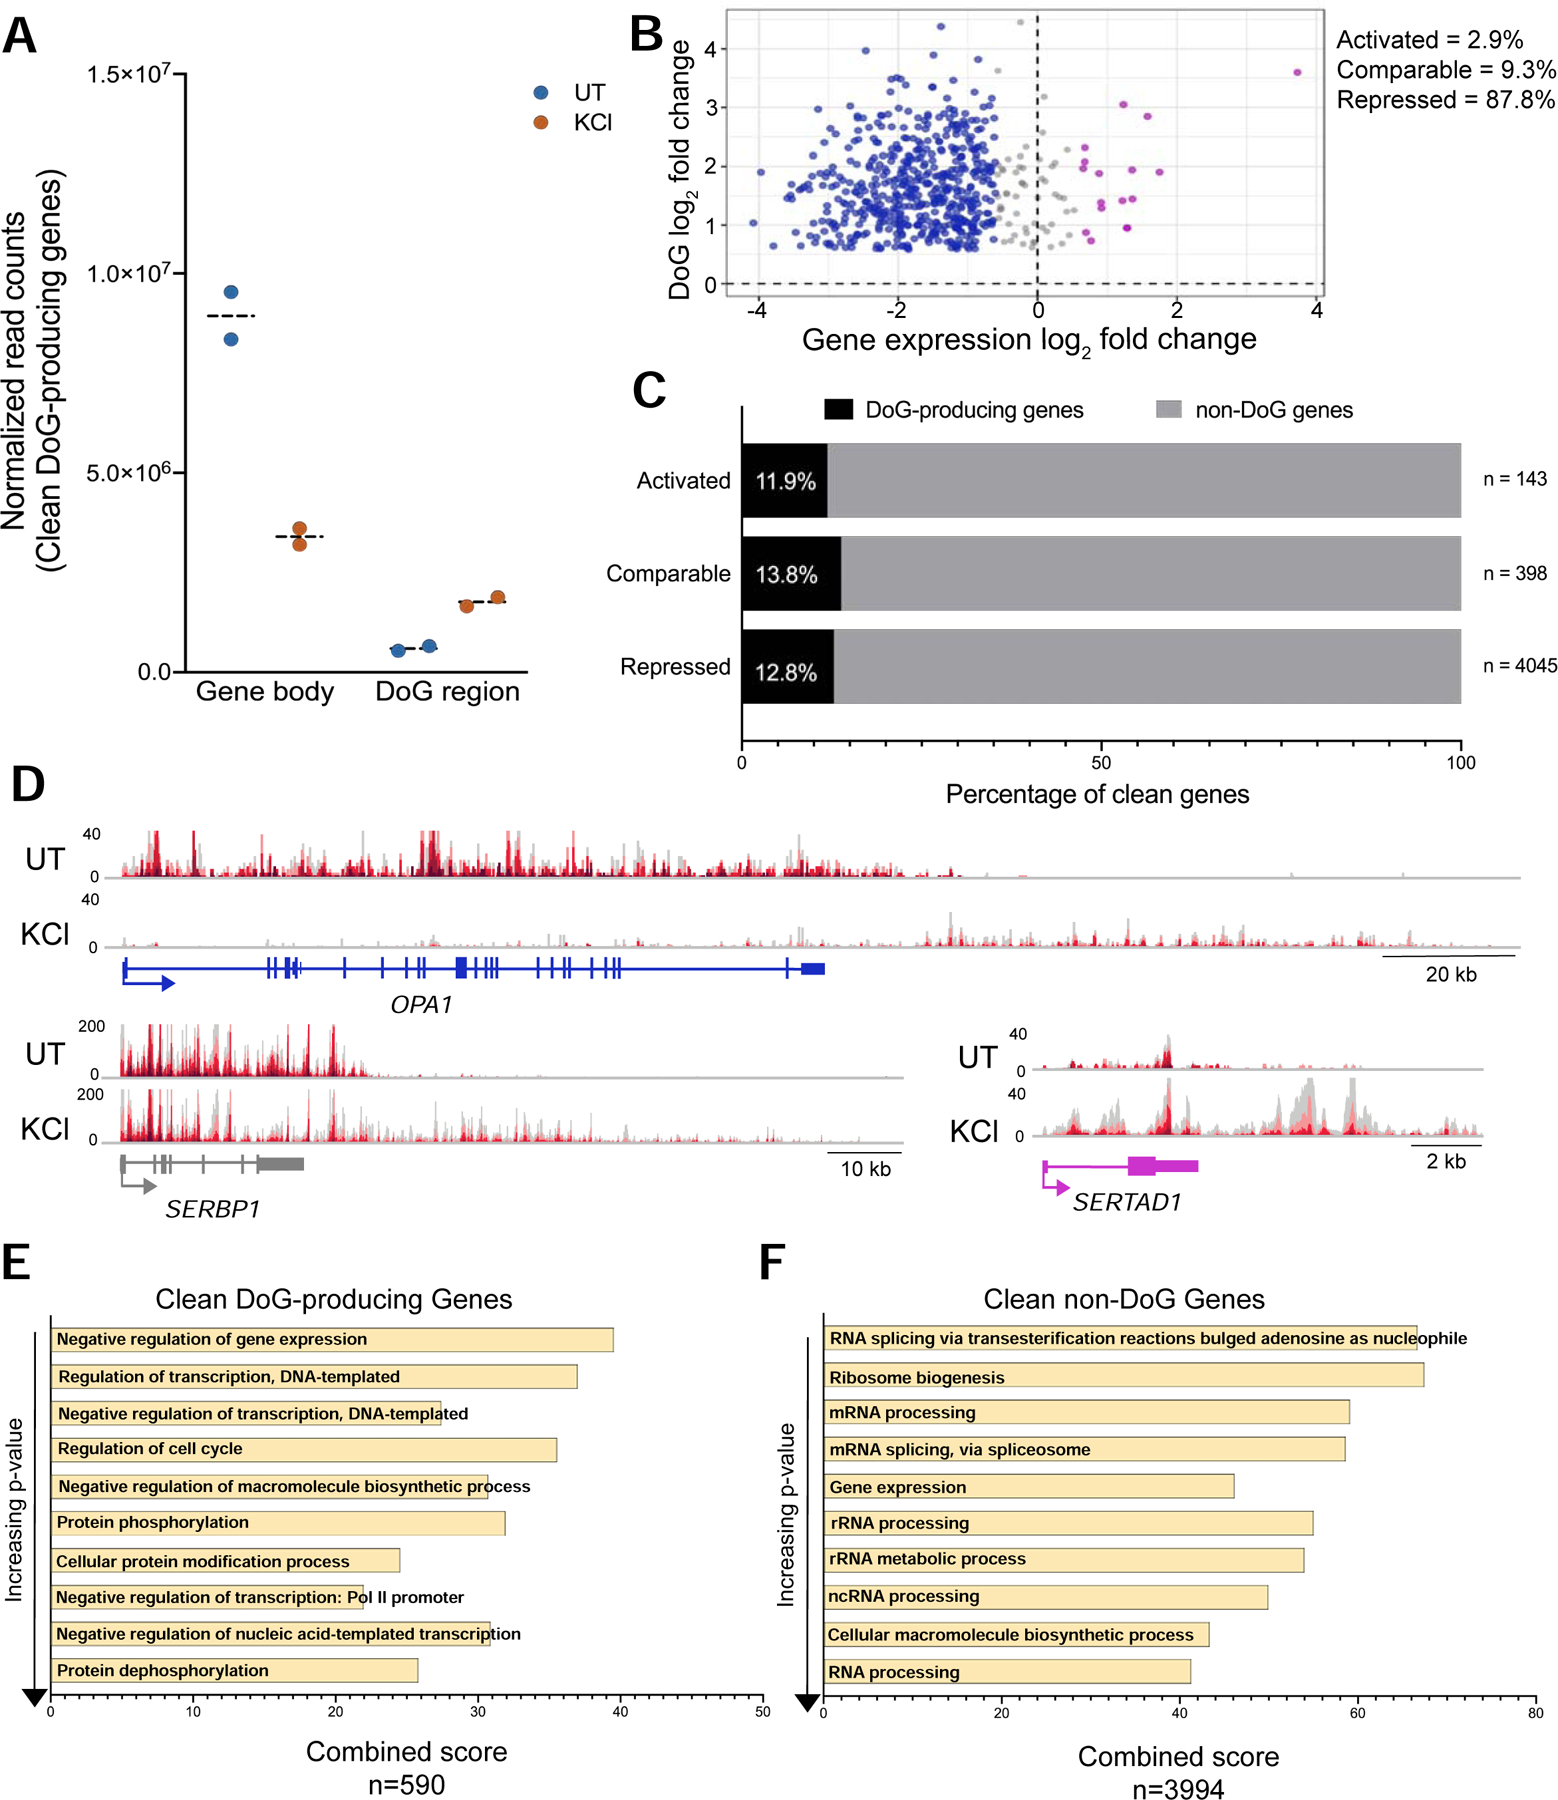
Figure 3:

DoGs arise regardless of the transcriptional levels of their upstream genes upon hyperosmotic stress. A) Interleaved scatter plot showing the sum of normalized TT-TL-seq read counts of DoG-producing clean genes and corresponding DoG regions (n=590) in untreated and KCl-treated HEK-293T cells for two biological replicates. B) Scatter plot showing clean gene log2 fold change (FC) for the gene body on the x-axis and the log2 FC for the DoG region on the y-axis. DoG-producing genes that are transcriptionally activated upon stress are represented in purple, genes retaining comparable levels of expression are gray and genes that are repressed are blue. C) Bar graph showing the percentage of DoG-producing clean genes (black) within each category of transcriptional regulation. D) Browser image showing UT and KCl TT-TL-seq reads for OPA1, a transcriptionally repressed DoG-producing clean gene (gene log2 FC= −3.22), for SERBP1, which retains comparable expression after stress (gene log2 FC= −0.45), and for a transcriptionally activated DoG-producing clean gene, SERTAD1 (gene log2 FC= 1.23). E, F) Bar graphs show gene ontology combined scores for the 10 most significantly enriched biological processes in order of increasing p-value for E) DoG-producing clean genes and for F) non-DoG clean genes. Combined scores are the product of the p-value and the z-score as calculated by Enrichr (Chen et al. 2013).
