Figure 5:

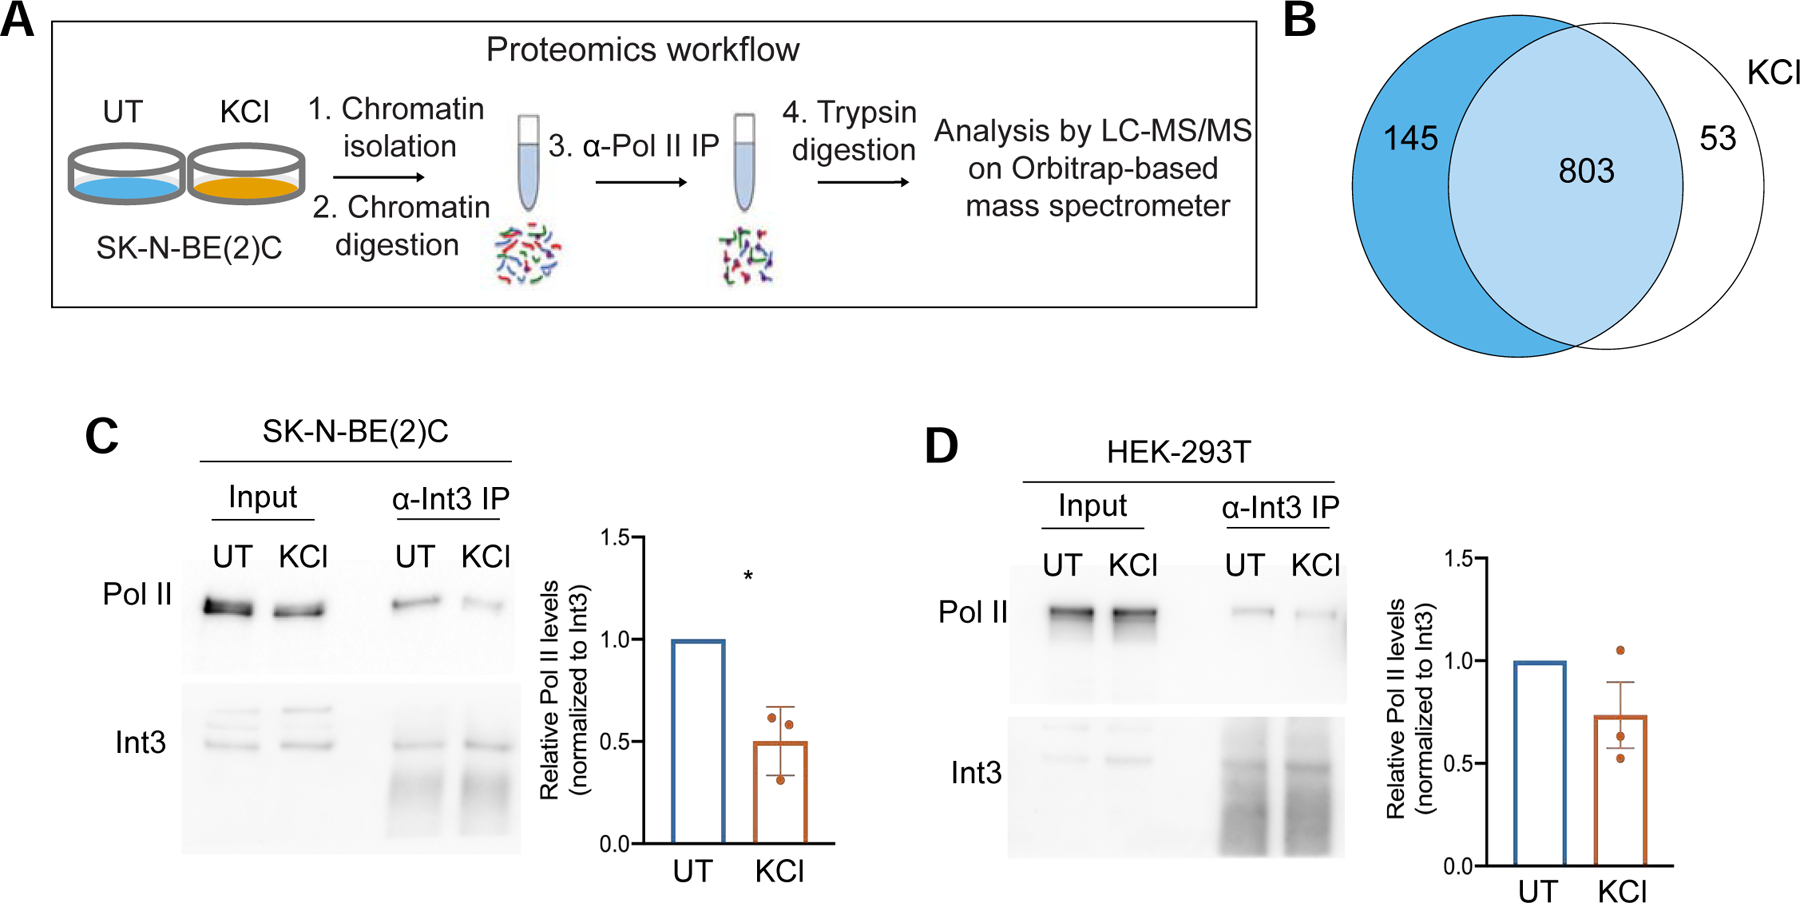
The Pol II interactome changes upon hyperosmotic stress. A) Experimental setup for mass spectrometry of anti-Pol II immunoprecipitates obtained from the chromatin fractions of SK-N-BE(2)C cells. B) Overlap between Pol II-associated proteins found in UT and KCl-treated samples (803). Peptides for 145 proteins were found only in the UT samples (blue) and peptides corresponding to 53 proteins were found only in the KCl-treated samples at least once across six replicates (white). C, D) Western blots of anti-Int3 immunoprecipitates obtained from chromatin fractions reveal decreased levels of associated Pol II in KCl-treated samples compared to untreated samples in C) SK-N-BE(2)C (p-value=0.0357) and in D) HEK-293T cells (p-value=0.2407). Chromatin fractions from these cell lines are shown as input. Around 8% of the total input and 11% of the immunoprecipitates were loaded on the gels.
