
Figure 6:
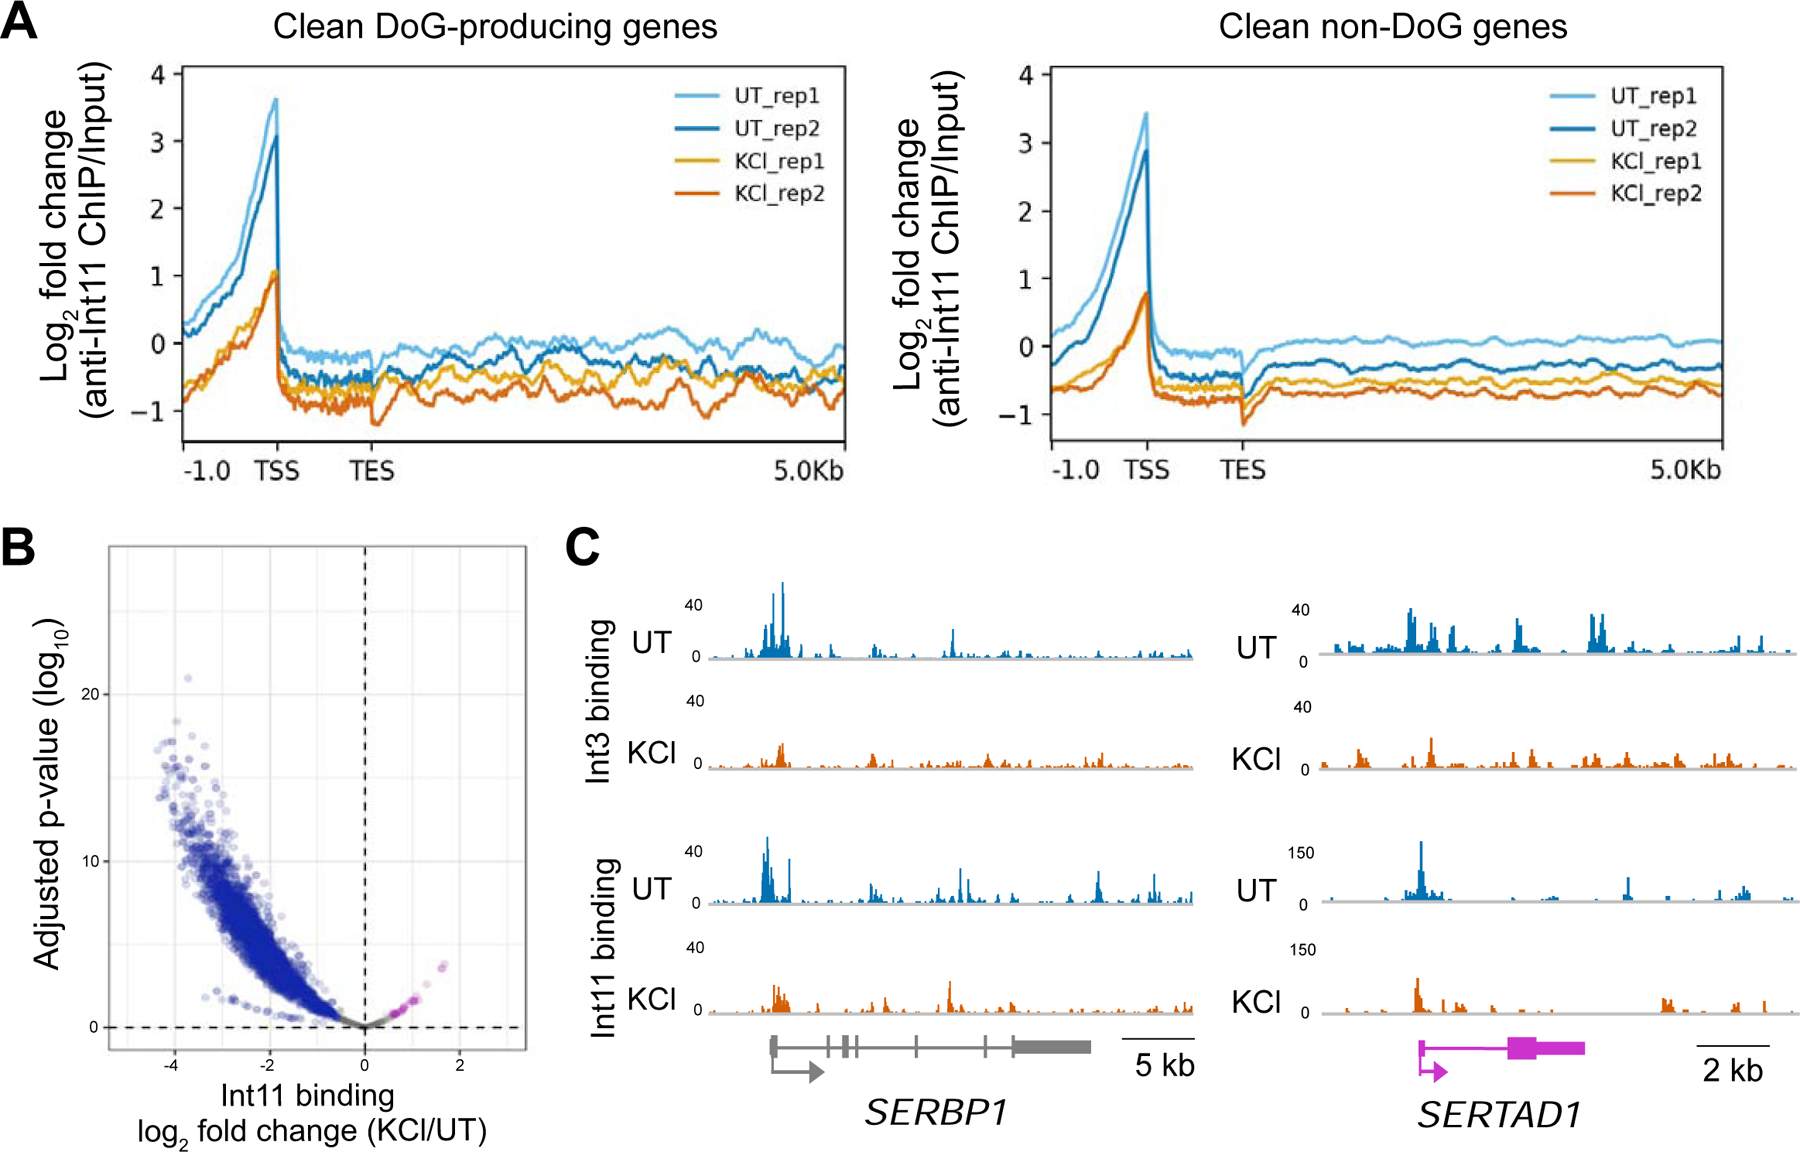
Hyperosmotic stress leads to decreased occupancy of Integrator subunits on DNA. A) Meta-plots showing the log2 fold change (FC) of anti-Int11 ChIP-seq normalized to input reveal decreased occupancy of Int11 near the TSSs of clean DoG-producing genes (n=590) and clean non-DoG genes (n=3994). B) Volcano plot of read counts for Int11 binding sites. Log2 FC of KCl/UT is shown on the x-axis with the corresponding adjusted p-values on the y-axis (n=3881). Sites where Int11 occupancy decreases after hyperosmotic stress are blue, sites where occupancy remains comparable are gray and sites where occupancy increases are purple. C) Browser images of anti-Int3 and anti-Int11 ChIP-seq tracks normalized to input for SERBP1 and SERTAD1, which are DoG-producing clean genes that are not repressed by hyperosmotic stress.