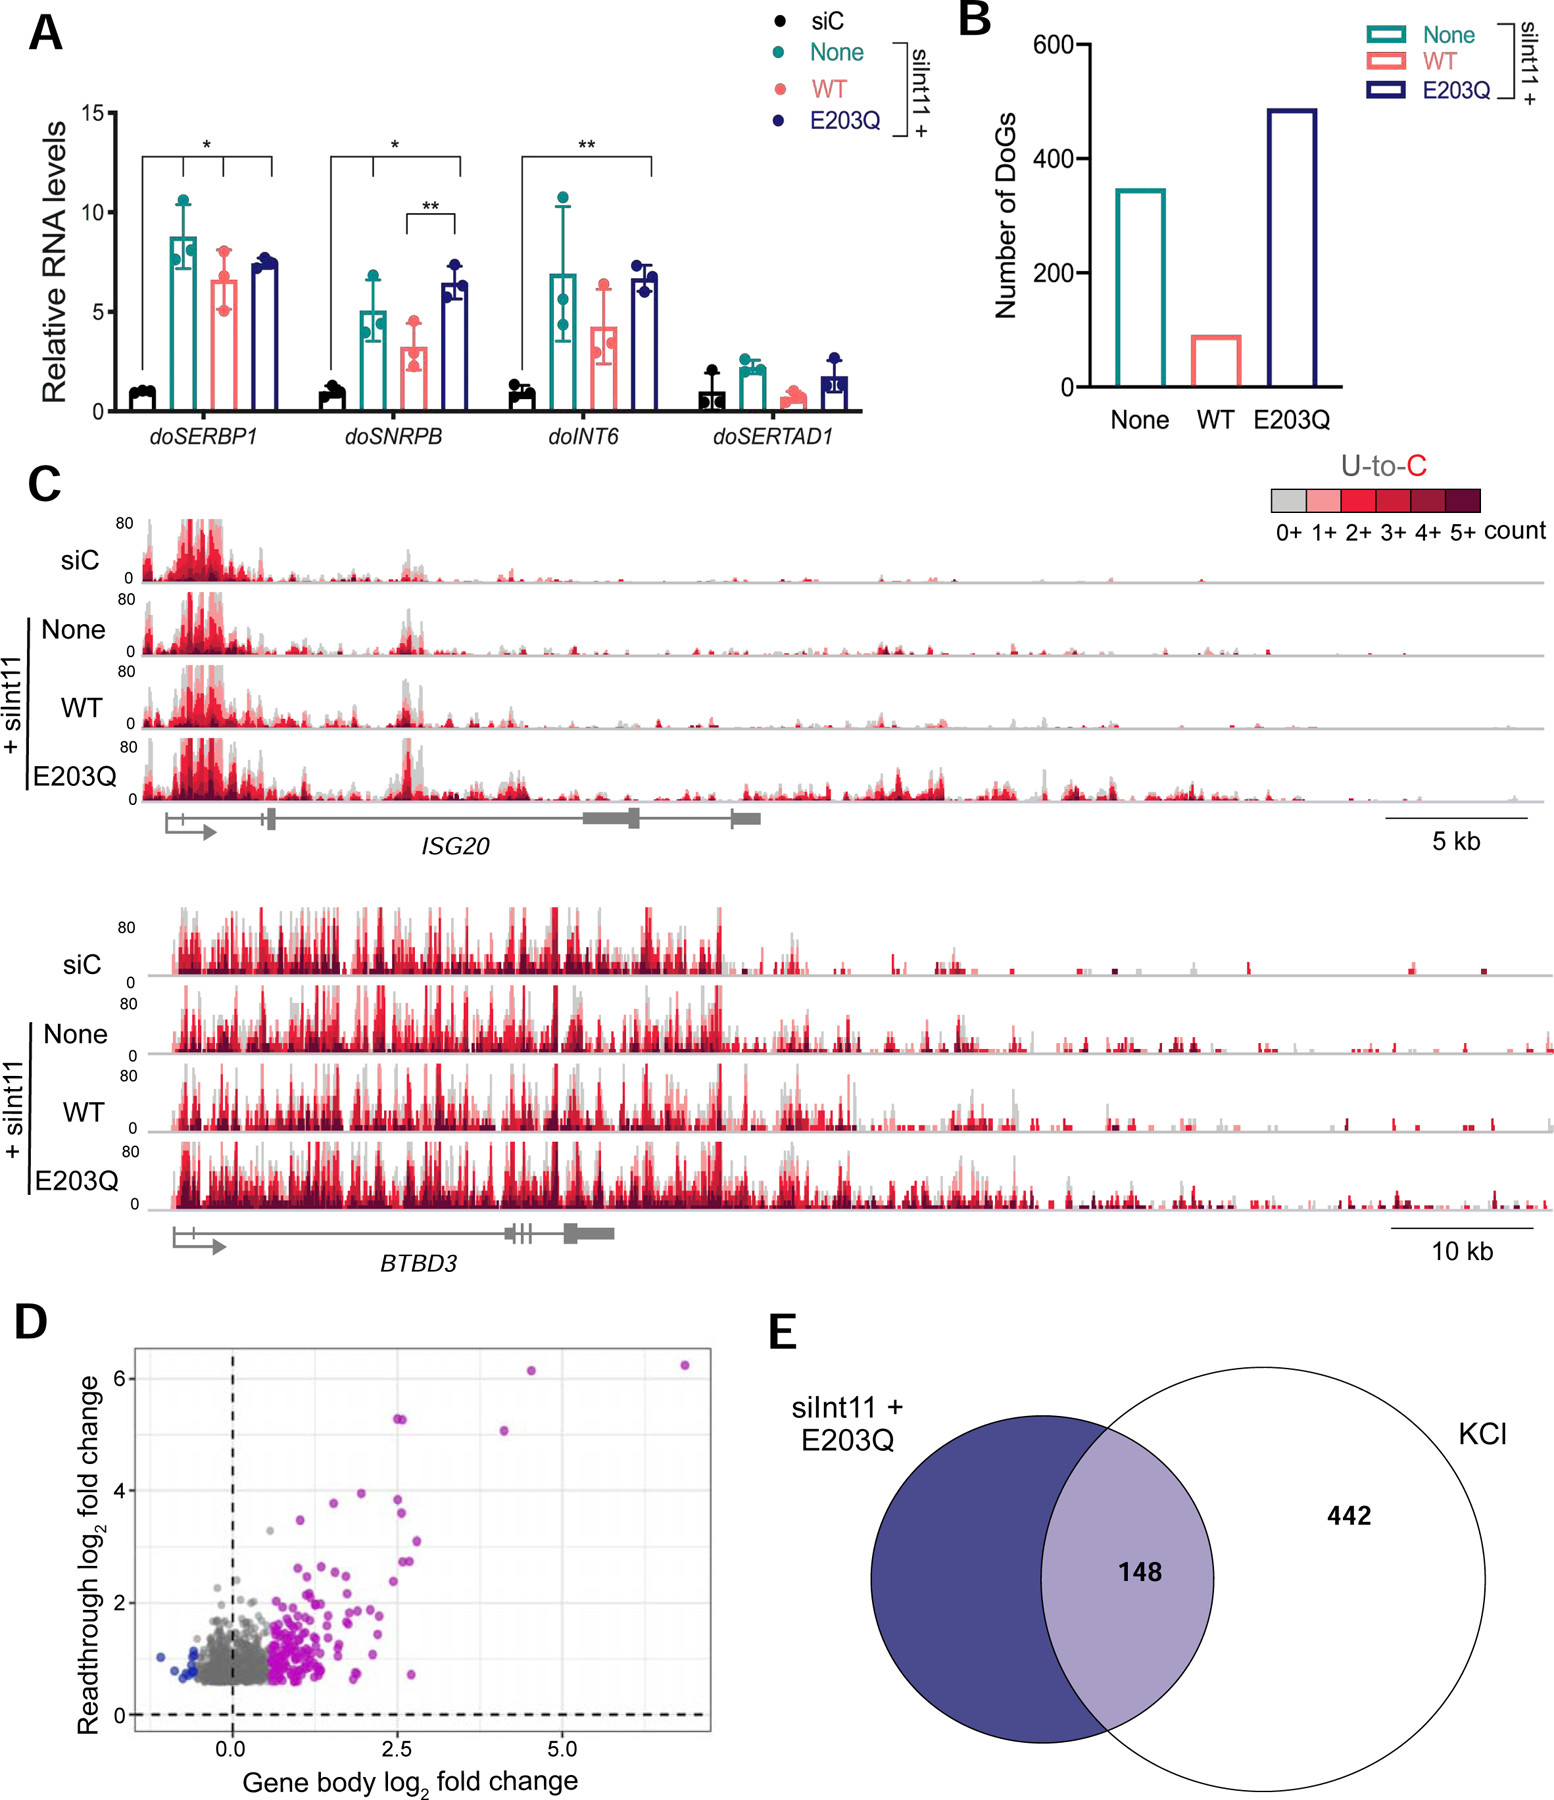
Figure 7:

Depletion of Integrator nuclease subunit leads to readthrough transcription. A) RT-qPCR analysis of DoG levels in HEK-293T cells transfected with a scrambled siRNA control (siC) or an siRNA targeting endogenous Int11 (siInt11). The siInt11-transfected cells expressed either exogenous wild-type Int11 (WT), catalytically inactive Int11 (E203Q) or no exogenous Int11 (None). Adjusted p-values compared to siC: None: doSERBP1=0.004; doSNRBP=0.032; doInt6=0.077; doSERTAD1=0.097; WT: doSERBP1=0.011; doSNRBP=0.091; doINT6=0.091; doSERTAD1=0.654; E203Q: doSERBP1=<0.001; doSNRBP=<0.001; doINT6=<0.001; doSERTAD1=0.337. B) Bar graph showing the number of DoGs induced after siRNA knockdown of endogenous Int11. C) Browser image of TT-TL-seq data for two genes that produce DoGs upon depletion of functional Int11. D) Scatter plot showing gene expression log2 fold change (FC) for siInt11+E203Q HEK-293T cells on the x-axis and the log2 FC of the corresponding readthrough transcripts on the y-axis. Genes that are activated in siInt11+E203Q cells compared to siC-transfected cells are purple, unaffected genes are gray and repressed genes are blue. All readthrough sites identified in the siInt11+E203Q sample are represented in this plot (n=840). E) Venn diagram displaying overlap between the identities of clean genes that produce readthrough transcripts in siInt11+E203Q cells (dark blue) and those of DoG-producing clean genes in KCl-treated samples (white).
