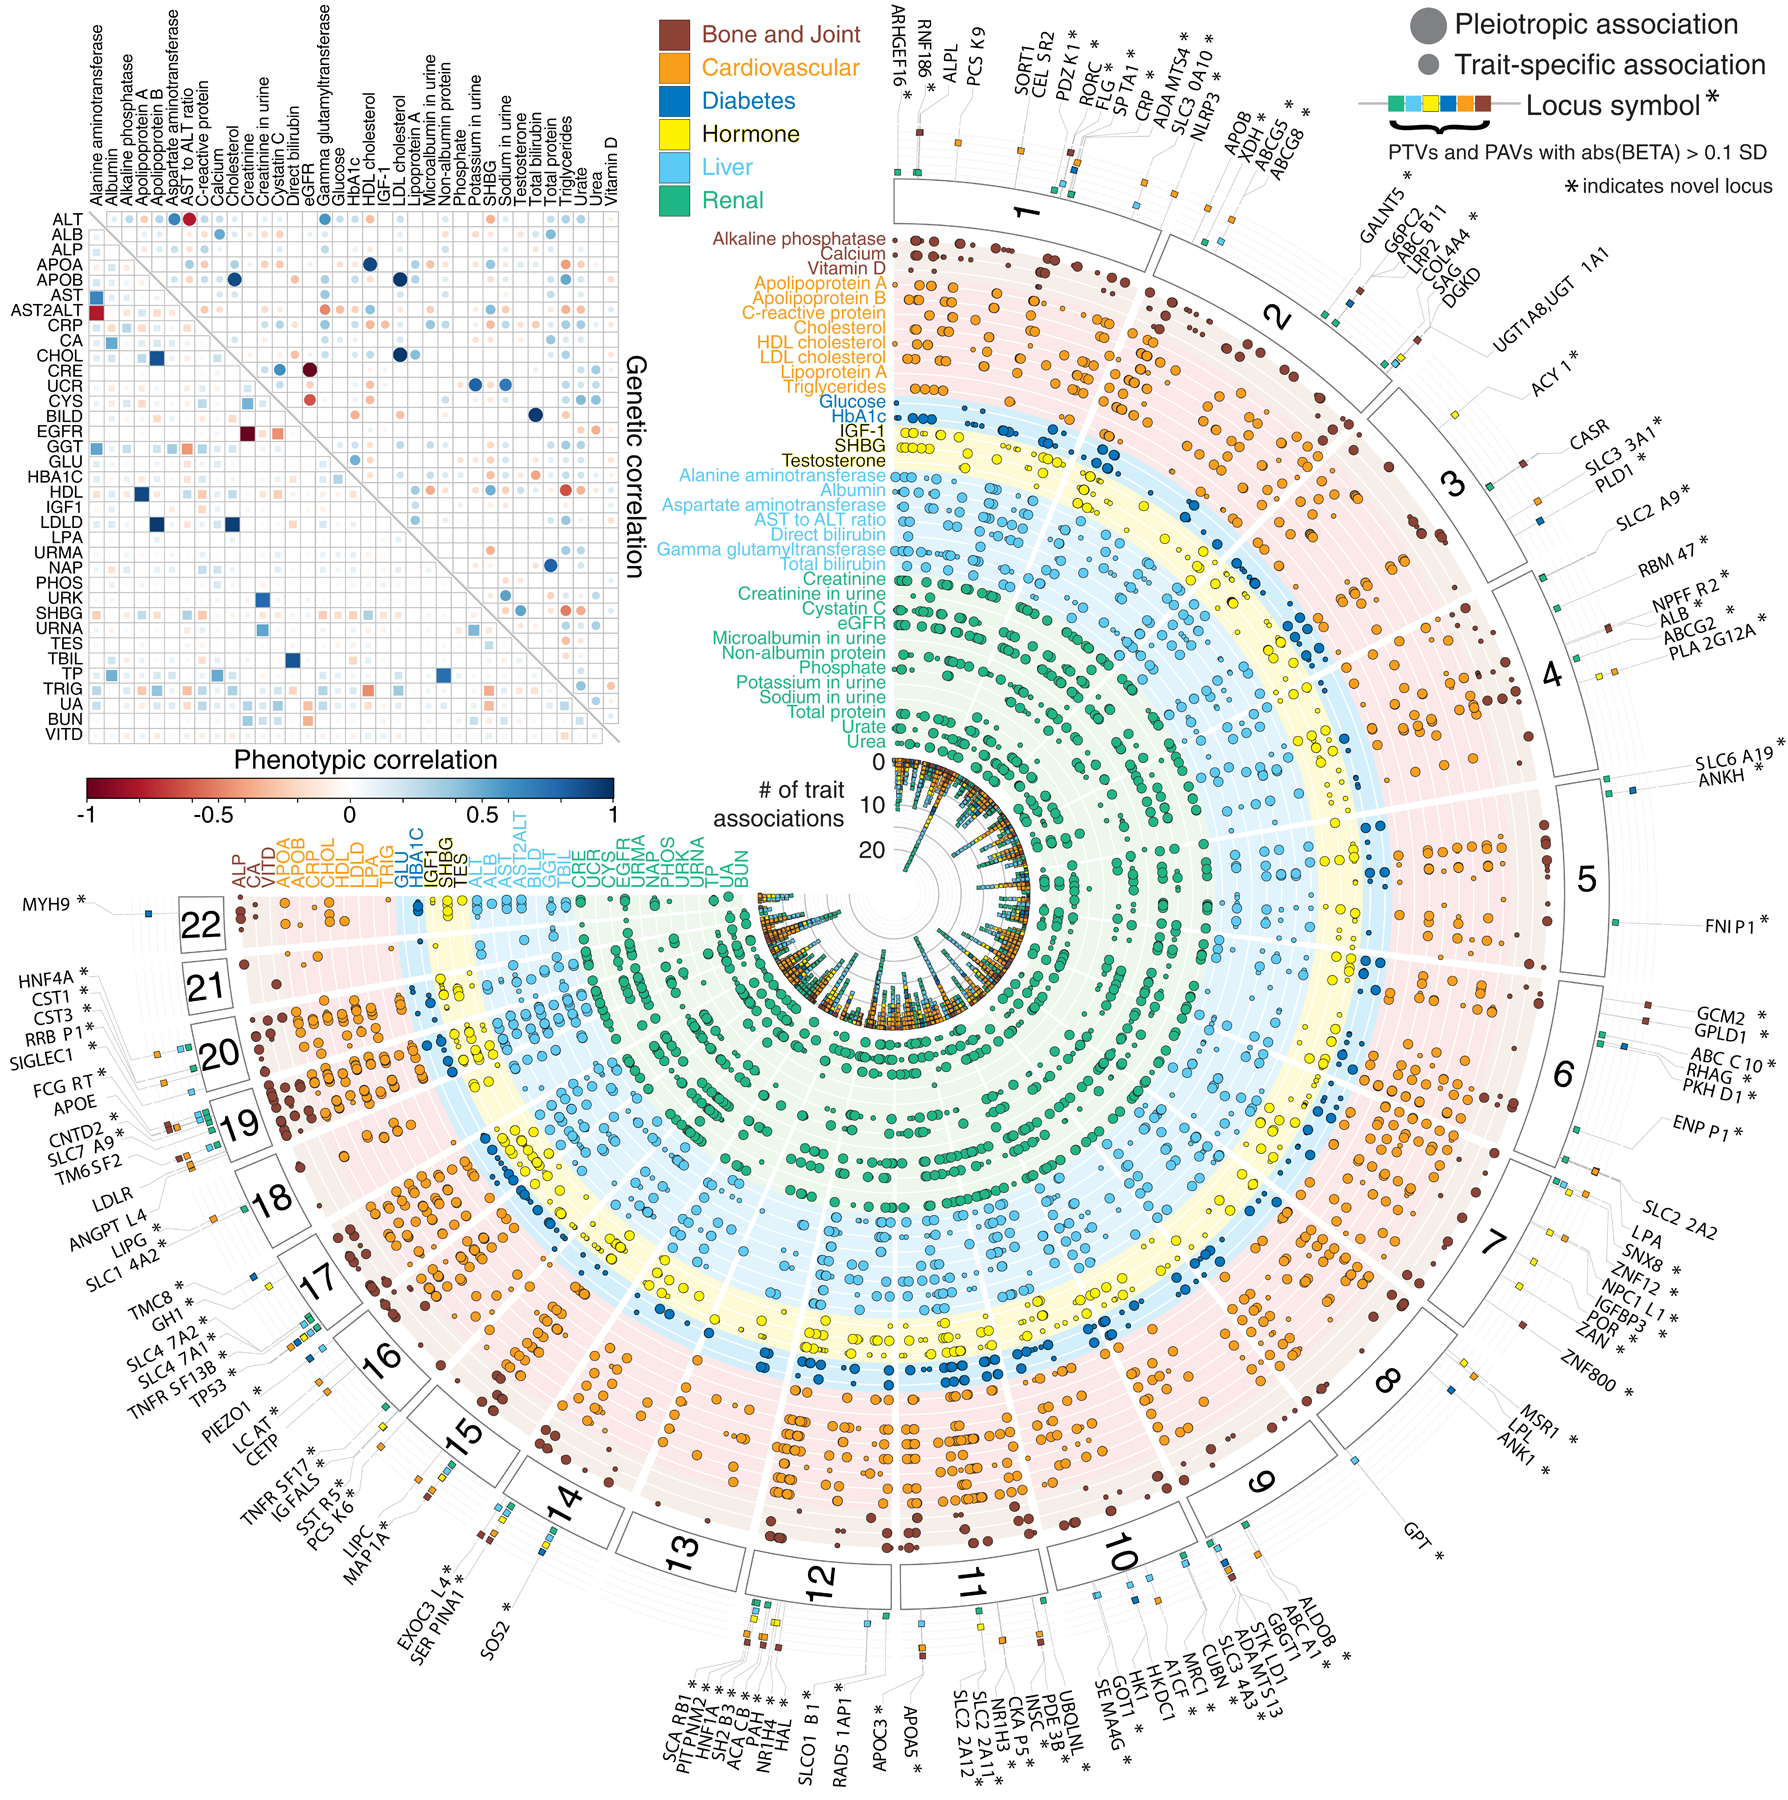
Figure 2. Genetics of 35 biomarkers. (top left inset).

Correlation of phenotypic (lower triangular matrix) and genetic (upper triangular matrix) effects plot between the 35 lab phenotypes, estimated using LD Score regression. The absolute heritability estimates with standard errors are in Supplementary Table 11a. (main panel) Fuji plot of lab phenotypes across the six categories provided by UK Biobank and genetic variant associations shown for LD independent variants with meta-analysis p < 5 × 10⁻⁹. Large-effect protein-truncating and protein-altering variants (labeled when abs(beta) >= 0.1 standard deviation [SD]) annotated with the category of association displayed (colored fill boxes) and highlighted if the loci were not previously reported in the comparison studies (Methods). Pleiotropic association and trait-specific association are shown by different sized circles. The p-values were from two-sided tests and were not corrected for multiple hypothesis testing.
