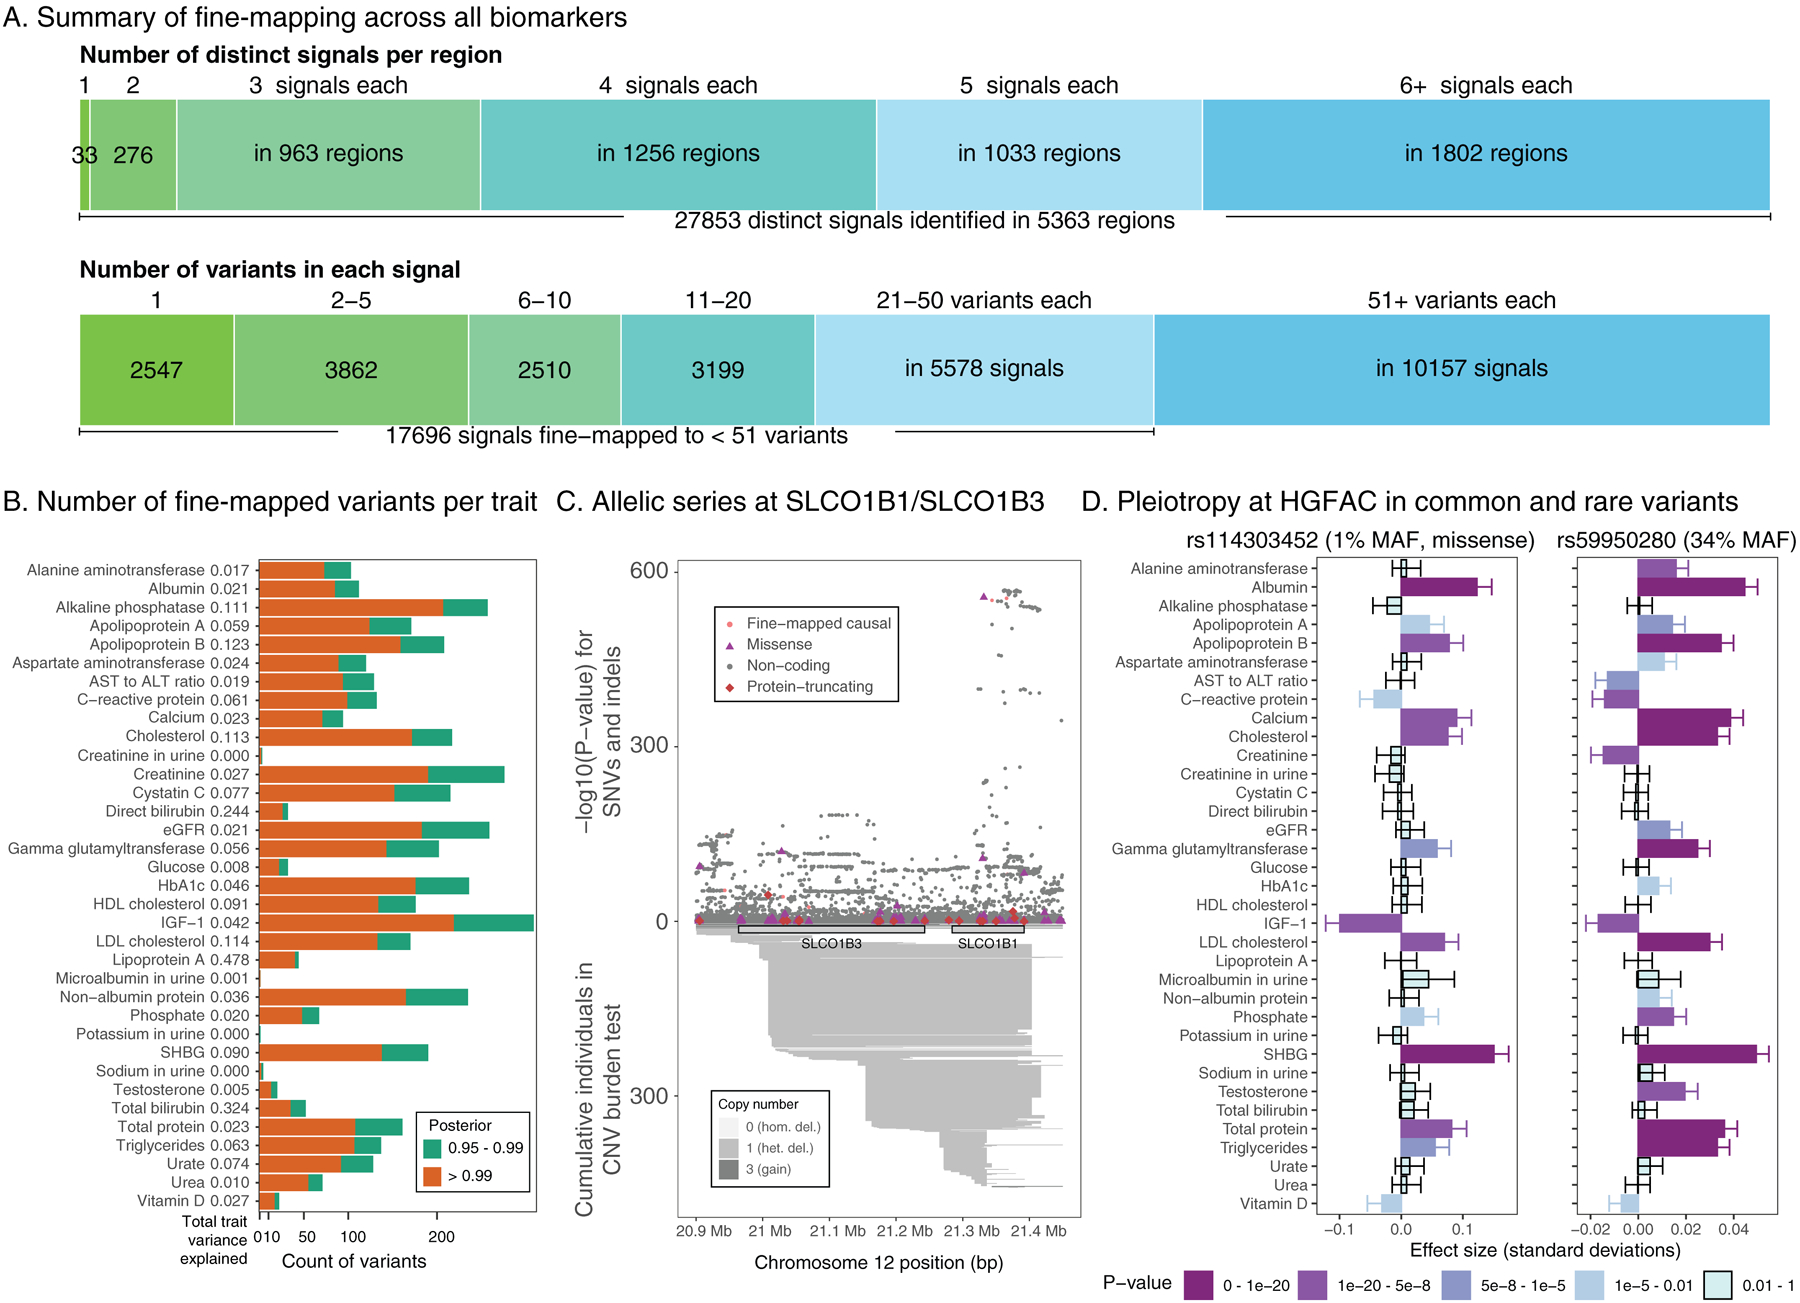
Figure 3. Summary of fine-mapped associations across 35 biomarker traits.

(a) FINEMAP analysis summary. (top) The number of identified distinct association signals (color gradient from green to blue) in each region with at least one genome-wide significant (UK Biobank meta-analysis p < 5 × 10⁻⁹) association and the number of regions are shown, such as a single signal at 33 regions and two to forty signals at 5,330 regions across 35 traits. (bottom) The number of identified candidate causal variants in the credible set with >= 99% posterior probability (color gradient from green to blue) and the number of signals are shown, such as 2,547 signals were mapped to a single variant in the credible set across 35 traits. (b) Breakdown of the number of fine-mapped associations with posterior probability greater than 0.95 or 0.99 across all biomarkers. Orange, posterior greater than 0.99, green, posterior between 0.95 and 0.99. The total variance explained for each trait is shown and in Supplementary Table 14b. (c) Allelic series showing combined missense, non-coding, and rare copy number variants at the SLCO1B1/SLCO1B3 on total bilirubin levels. Copy number variants annotated below axis and SNPs and short indels annotated above the axis. (d) Pleiotropic effects of fine-mapped rare coding (rs114303452, left) and common non-coding (rs59950280, right) variants at the HGFAC locus. Darker colors of purple indicate more significant associations. The p-values were from two-sided tests and were not corrected for multiple hypothesis testing. The error bars represent standard deviations.
