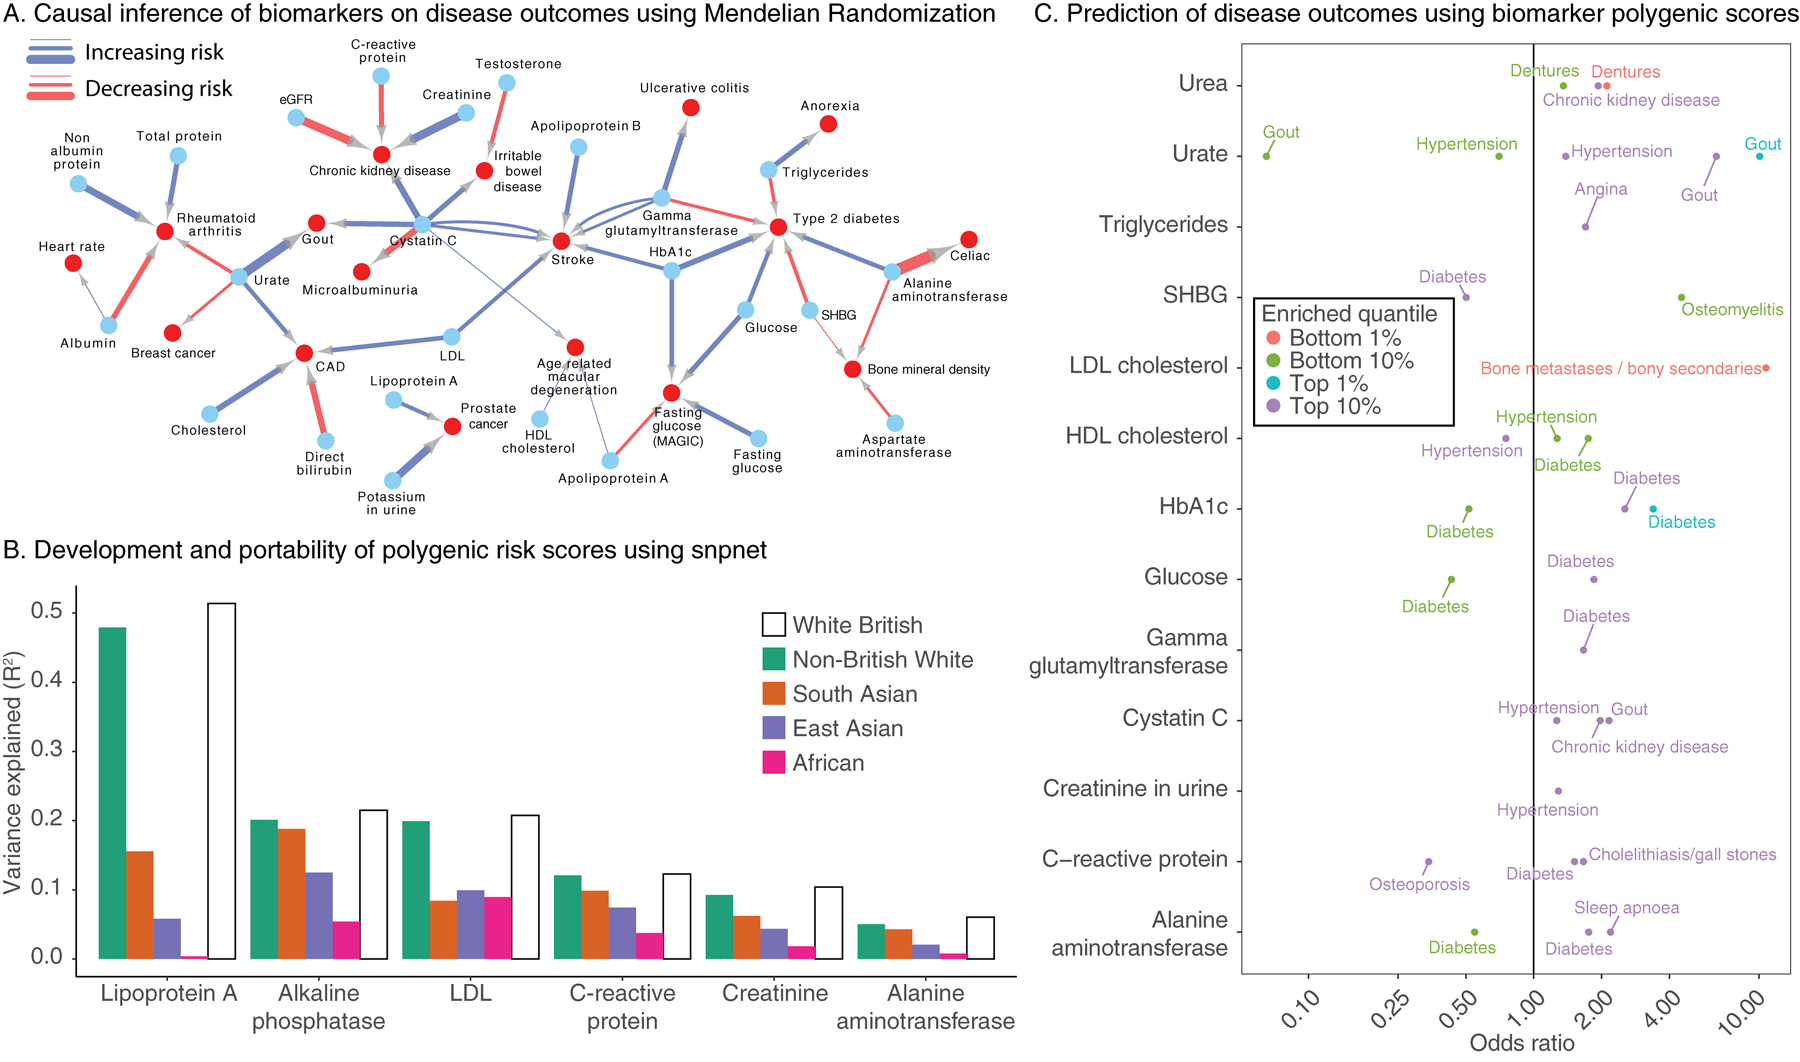
Figure 4. Causal inference, transferability of polygenic risk scores, and complex trait association in polygenic risk tails.

(a) Mendelian Randomization estimates causal links between biomarkers (blue nodes) and selected complex traits (red nodes). Association arrows are drawn based on effect direction (red decreasing, blue increasing). Associations were adjusted for FDR 5% cutoff across all tests (Methods, Supplementary Table 16). Edge width is proportional to the absolute causal effect size (log odds per standard deviation). (b) Summary of prediction accuracy of the snpnet polygenic scores across traits, evaluated on a held-out test set in White British as well as other 4 populations in UK Biobank. (c) (x-axis) Biomarker polygenic risk scores for the top 1%, top 10%, bottom 1%, and bottom 10% of individuals and their association to different diseases in UK Biobank, represented as the odds ratio of the disease in this group relative to the 40–60% quantiles. Traits without rows did not have any outcomes with FDR-adjusted significant associations.
