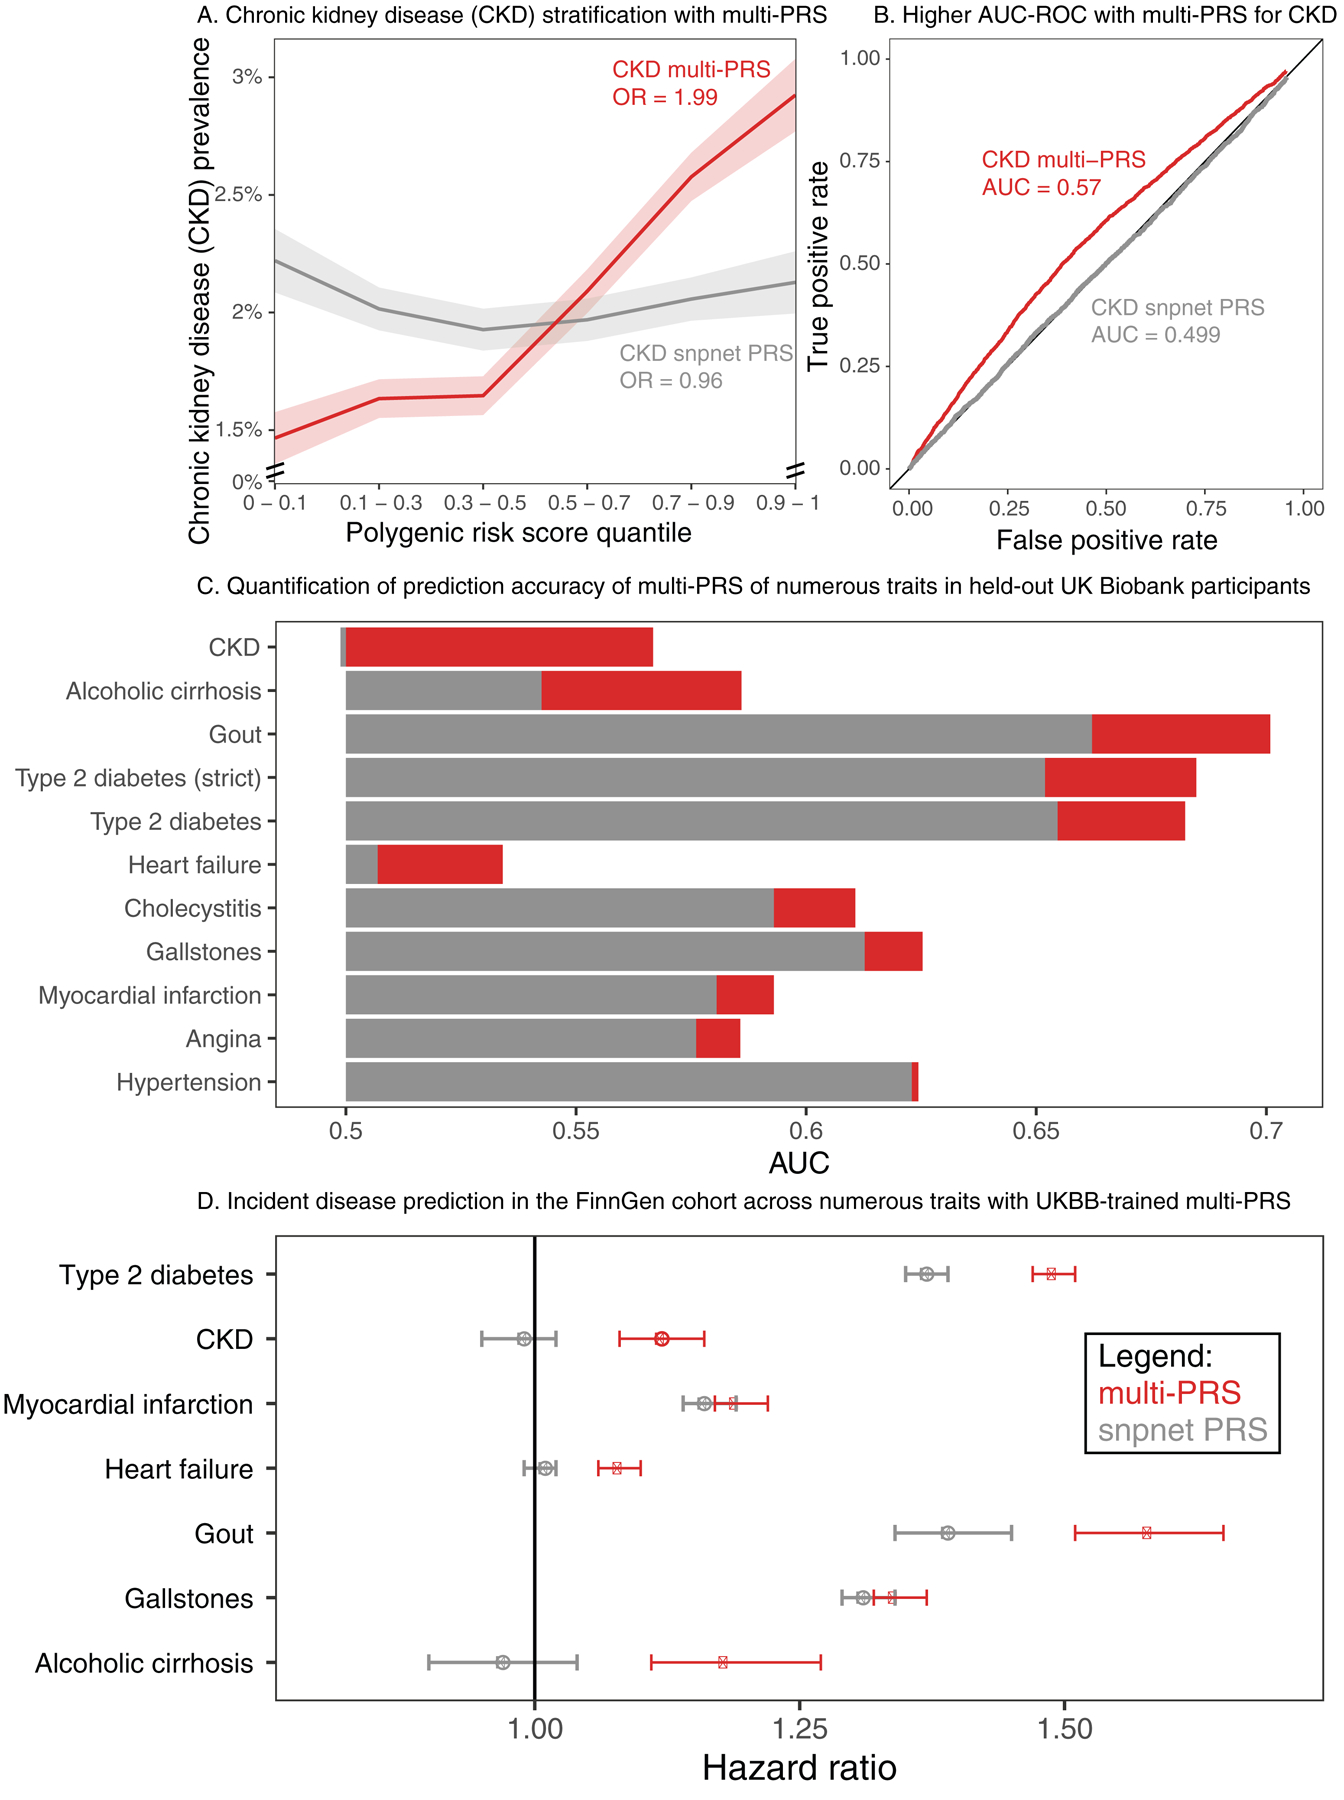
Figure 5. Multiple regression with biomarker polygenic scores improve prevalent and incident disease prediction.

(a) (x-axis) quantiles of polygenic risk score, spaced to linearly represent the mean of the corresponding bin of scores. (y-axis) Prevalence of chronic kidney disease (n = 2,780 cases and n = 89,409 total, defined by verbal questionnaire and hospital in-patient record ICD code data) within each quantile bin of the polygenic risk score. Error bars represent the standard error around each measurement, and individuals evaluated are held-out European-ancestry individuals in UK Biobank. (b) ROC curve with AUC for chronic kidney disease, comparing the snpnet-derived polygenic score to a multi-PRS model trained across biomarkers as well. Individuals evaluated are held -out European-ancestry individuals in UK Biobank. (c) AUC-ROC estimates for prediction of 10 disease outcomes in a held-out test set of the UK Biobank. Diabetes was run using both a strict definition (excluding from control individuals with HbA1c < 39) and the complete sample (Methods). (d) Hazard ratios for the incidence of type 2 diabetes (n = 17,519), chronic kidney disease (n=3,058), myocardial infarction (n=7,913), heart failure (n = 13,965), gout (n = 1,936), gallstones (n = 11,629), and cirrhosis (n=845) in FinnGen using the standard single-disease PRS trained on UK Biobank using snpnet versus the multi-PRS including both biomarker PRSs and the trait PRS. The strict definition of type 2 diabetes is shown. Error bars represent 95% confidence intervals and points represent mean hazard ratio estimates.
