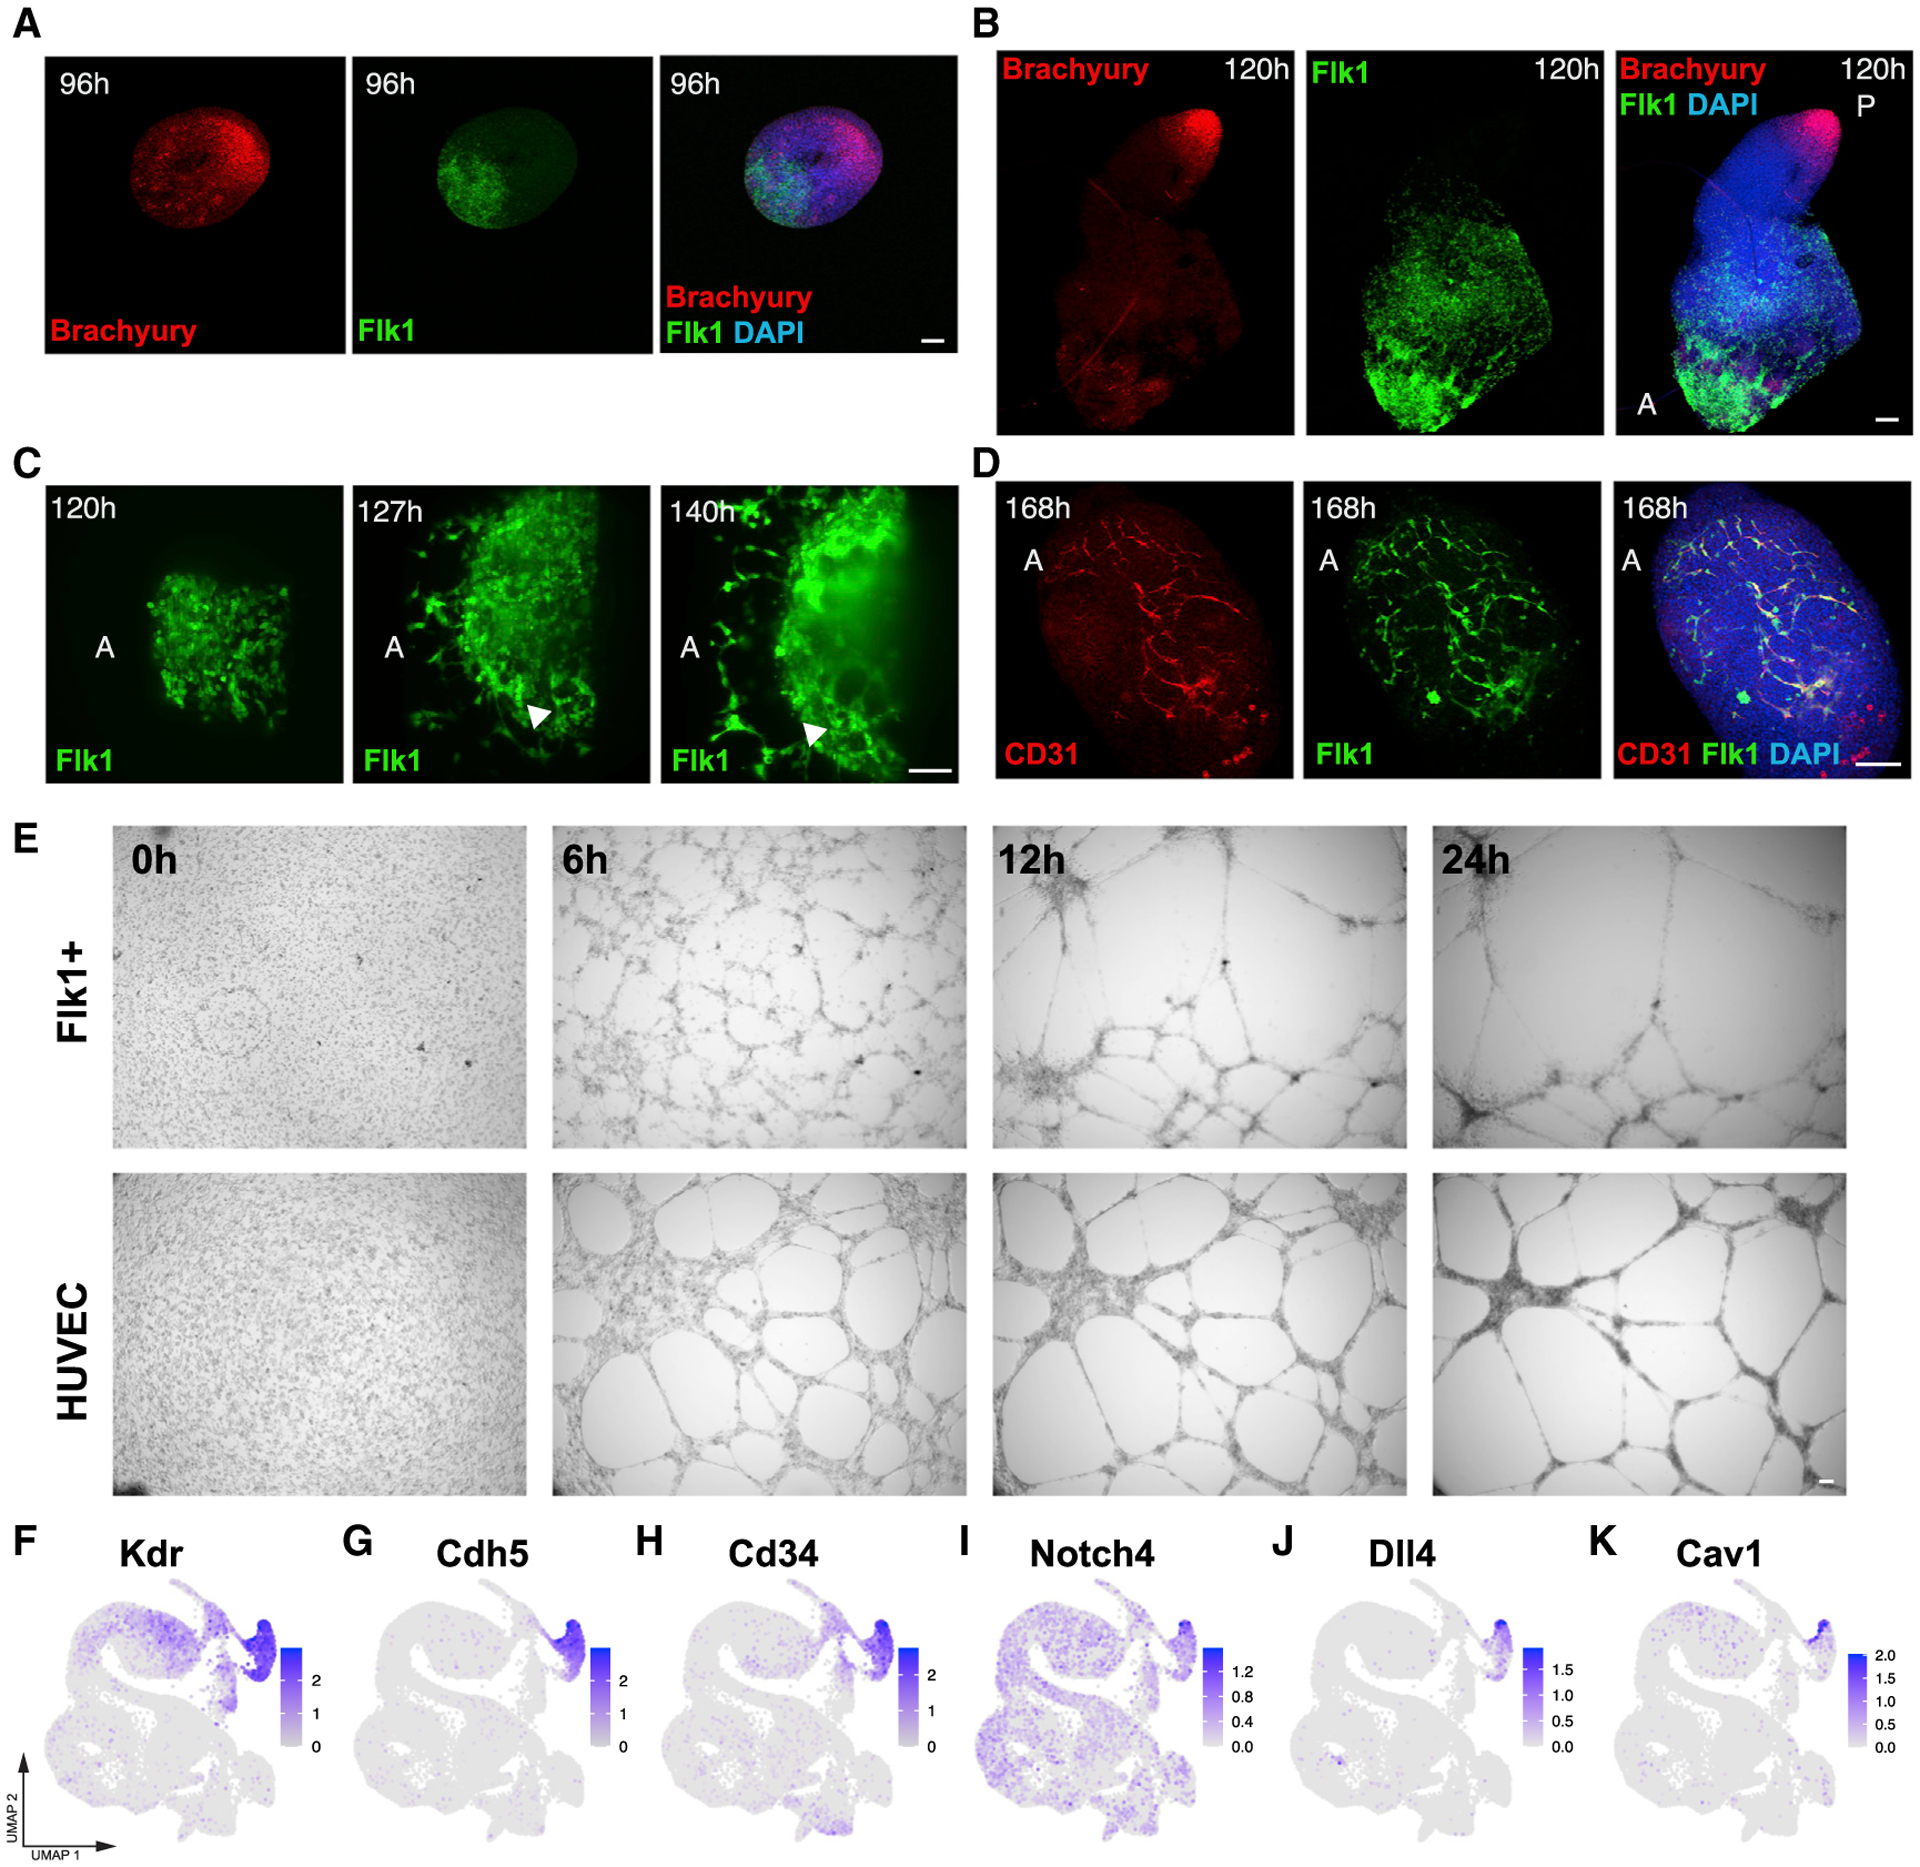
Figure 3. Development of a Vascular-like Network.

(A and B) Spatial localization of Flk1+ cells at (A) 96 and (B) 120 h compared to Brachyury expression. Image in (B) is a composite of two separate images.
(C) Light-sheet live imaging of the anterior portion of Flk1-GFP gastruloids from 120 to 144 h, highlighting the formation of a vascular-like network.
(D) The Flk1+ vascular-like network is positive for CD31.
(E) Angiogenesis assay showing tube formation in isolated Flk1+ cells compared to HUVECs.
(F–K) UMAP plots showing the expression of endothelial marker genes (F–H) and genes related to endothelial cell maturation and morphogenesis (I–K) in the scRNA-seq dataset.
Scale bars, 100 μm. See also Figure S3.
