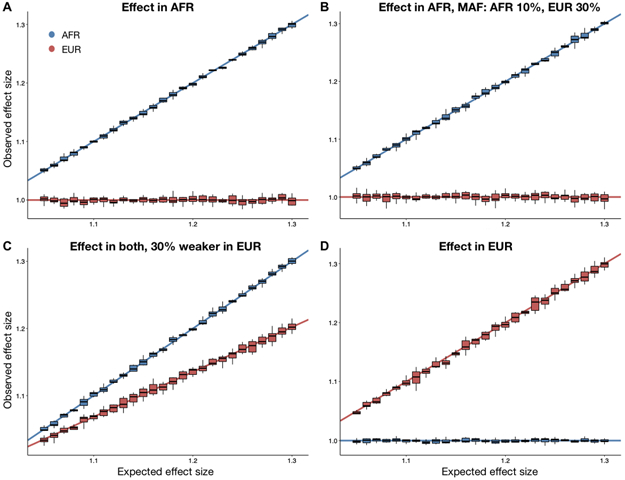
Figure 3. Tractor accurately estimates ancestry-specific effect sizes.
Boxplots show the effect size estimated by Tractor as compared to that modeled in the simulation across a range of effect sizes where the center is the median, the bounds of box represent the first quantile to third quantile, and whiskers are 1.5 * IQR. The lines indicate the simulated values for each ancestry. Blue represents effects in AFR, red in EUR. The models presented all include 1000 simulation replicates with 12k cases, 30k controls at 10% disease prevalence in a realistic AA population with an admixture ratio of 80/20 AFR/EUR. Unless otherwise noted, the risk allele MAF was set at 20% in both ancestries. (A) The initial simulation framework of an effect only in AFR. (B) An effect only in AFR with differing minor allele frequencies across ancestries: AFR being 10% and EUR 30%. (C) An effect in both ancestries, with a 30% weaker effect modeled in the EUR. (D) Effect only in EUR.

