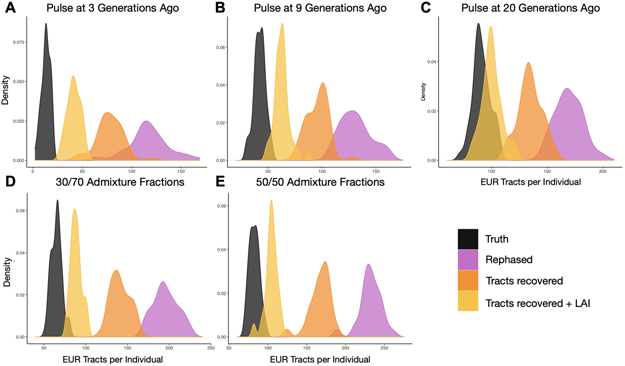
Extended Data Fig. 2. Tractor recovers disrupted tracts, improving tract distributions.
The top row (A-C) shows the improvements to the distributions of the number of discrete EUR tracts observed in simulated AA individuals under demographic models of 1 pulse of admixture at 3, 9 (realistic for AA population history) and 20 generations ago. The bottom row (D,E) shows the results from different initial admixture fractions, of 70% and 50% AFR, respectively, at 9 generations since admixture. These can be compared to the inferred realistic demographic model shown in B. In all panels, the simulated truth dataset is shown in black, after statistical phasing in purple, immediately after tract recovery procedures is in orange, and after one additional round of LAI after tract recovery in yellow.

