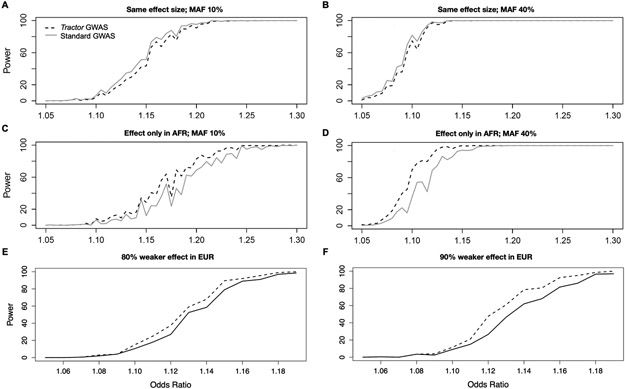
Extended Data Fig. 3. The contribution of absolute MAF and effect size to Tractor power.
All cases assume an 80/20 AFR/EUR admixture ratio, 10% disease prevalence, 12k cases/30k controls with an effect only in the AFR genetic background. In all panels, the solid line uses a traditional GWAS model while the dashed line is our LAI-incorporating Tractor model. (A,B): Equal effect in EUR and AFR with shifted absolute MAF. (C,D): effect only in AFR background. (A,C): MAF is set to 10% in both AFR and EUR. (B,D): MAF is set to 40% in both AFR and EUR. Panels E and F illustrate the heterogeneity in effect sizes required to observe gains in Tractor power over traditional GWAS assuming 20% MAF in both ancestries and an effect that is stronger in AFR with varying difference to the EUR effect.

