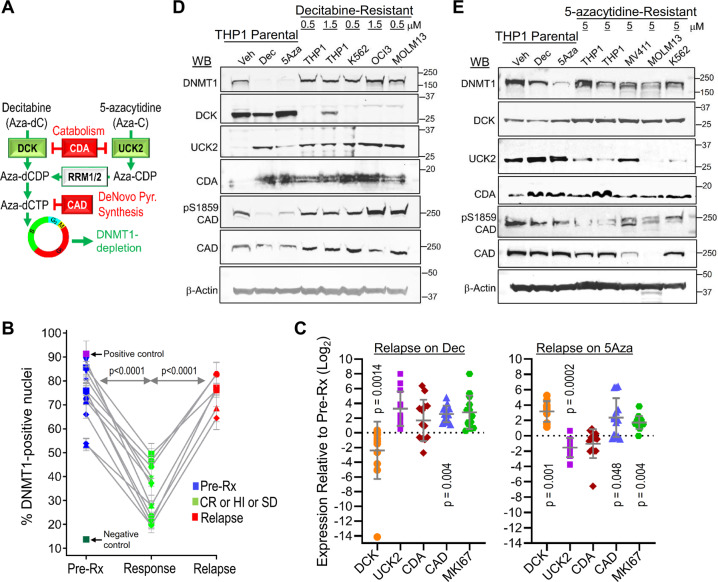
Fig. 1. DNMT1 is not depleted at clinical or in vitro resistance.
a Schema shows key pyrimidine metabolism enzymes that favor (green) or impede (red) decitabine (Dec) or 5-azacytidine (5Aza) conversion into DNMT1-depleting Aza-dCTP. dCDP = deoxycytidine diphosphate; CDP = cytidine diphosphate; dCTP—deoxycytidine triphosphate. b Dec or 5Aza decreased bone marrow DNMT1 at clinical response (green) versus pretreatment (dark blue) but not at relapse (red). Serial bone marrow biopsies from the same patent were cut onto the same slide, stained for DNMT1, and the number of DNMT1-positive nuclei was quantified objectively using ImageIQ software (n = 13 patients; positive/negative controls were wild-type and DNMT1-knockout HCT116 tissue blocks respectively). Pre-Rx = pretreatment; HI = hematologic improvement; CR = complete remission; SD = stable disease. Mean ± SD of ≥3 image segments (cellular regions) per sample; p value paired t-test, two-sided. c Pyrimidine metabolism enzyme expression at relapse on Dec or 5Aza. Bone marrow cells aspirated pretreatment and at relapse/progression on Dec (13 patients, median duration of therapy 175 days, range 97–922) or 5Aza (14 patients, median duration of therapy 433 days, range 61–1155) were analyzed by QRT-PCR. Mean ± SD, paired t-test, two-sided. d, e DNMT1 and pyrimidine metabolism enzyme protein expression in Dec- or 5Aza-resistant AML cells. We selected for AML cells THP1, K562, MOLM13, and OCI-AML3 or MV411 growing exponentially through Dec or 5Aza at the indicated concentrations. Parental THP1 AML cells treated with vehicle, Dec 0.25 µM or 5Aza 2.5 µM were included for comparison purposes. Primary antibodies for P-S1859 and total CAD were both rabbit and thus probed on separate gels/blots. CDA analysis was in nuclear fractions. Equal loading was confirmed for all Western blots.

