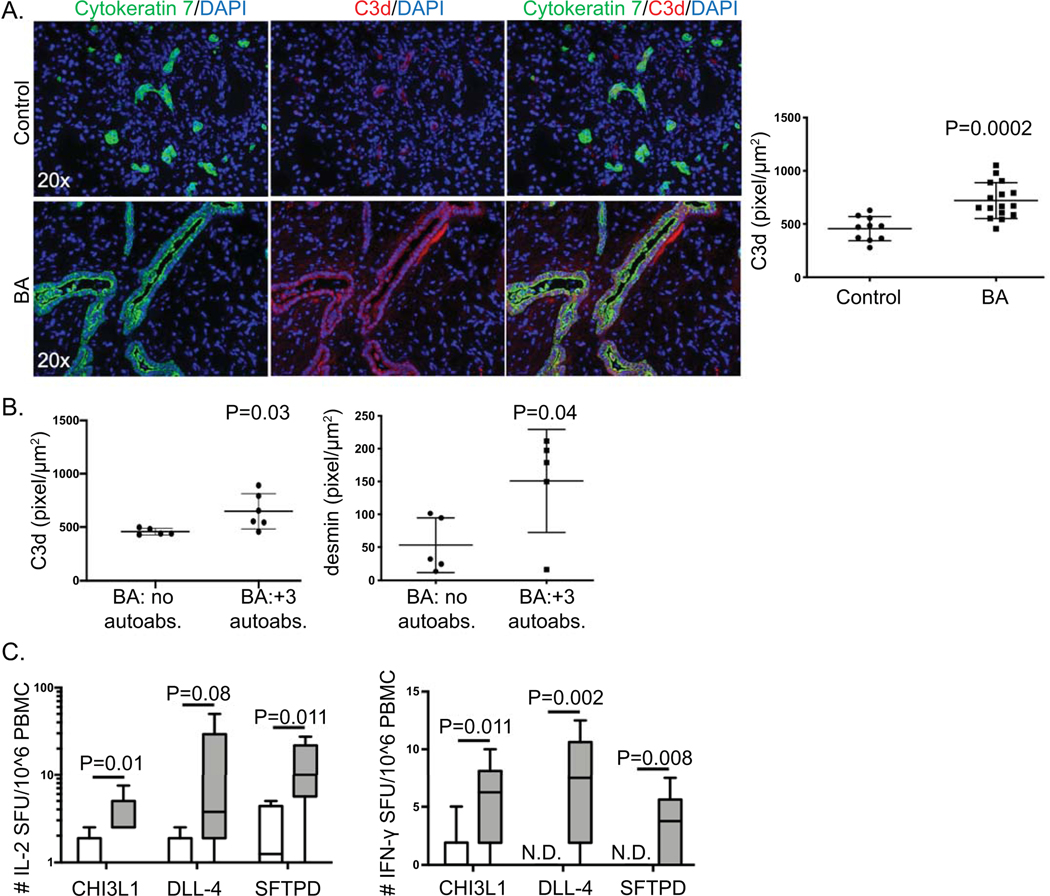
Figure 6. Immune pathways associated with humoral immunity in BA.
(A) Representative immunofluorescence of cytokeratin 7 (green) and C3d (red), counterstained with nuclear DAPI (blue) on frozen liver tissue from controls or BA at time of liver transplant. Right panel: Quantitative fluorescence intensity analysis of C3d expression per μm2 of cytokeratin 7 positive cells. (B) Quantitative fluorescence intensity analysis of C3d and desmin expression per μm2 portal tract regions in BA subjects negative for all 3 IgM autoantibodies (BA: no autoabs.) or positive for all 3 IgM autoantibodies (BA: +3 autoabs.) (C) Peripheral blood autoreactive T cells specific to CHI3L1, DLL-4 and SFTPD in BA. Peripheral blood mononuclear cells (PBMCs) were cultured with either CHI3L1, DLL-4, or SFTPD. Autoantigen stimulation of T cells was quantified based on production of IL-2 (a) and IFN-γ (b) by ELISPOT analysis [readout is number of spot forming units (SFU) per million PBMCs]. N.D.- not detected. Positive control PHA- too numerous to count SFU; negative control media alone- N.D..

