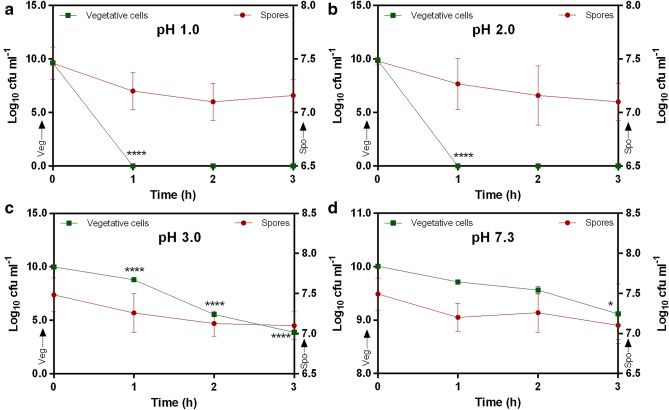
Fig. 1.
Acid tolerance of spores and vegetative cells of Bacillus clausii UBBC07. Panel a pH 1.0; b pH 2.0; c pH 3.0; d pH 7.3 (control). The primary y-axis indicates vegetative cell count and secondary y-axis for spores. All data are represented as mean ± SD. *p < 0.05; ****p < 0.0001: significant difference compared to initial or 0 time point

