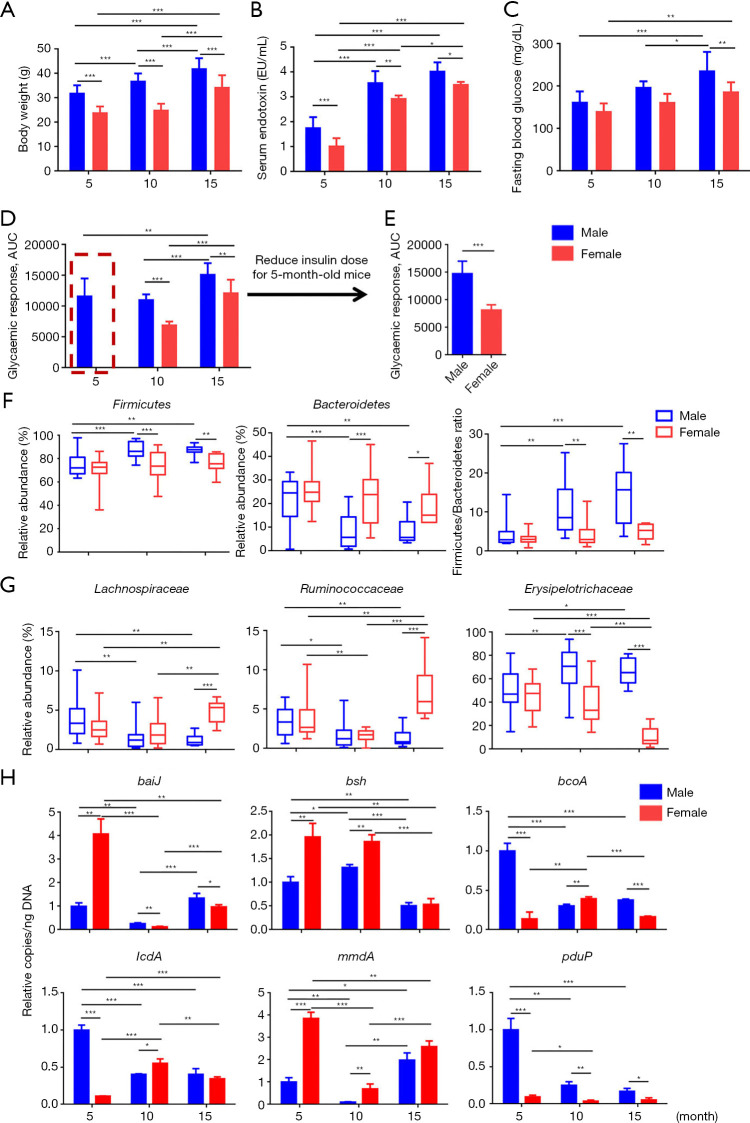
Figure 2.
The changes of mouse phenotype and gut microbiota profile during aging. (A) Body weight; (B) serum endotoxin (LPS); (C) fasting blood glucose level; (D,E) area under curve (AUC) of insulin tolerance test in 5-, 10-, and 15-month-old mice of both sexes. Two-way ANOVA with Tukey’s correction. (F,G) Relative abundance of fecal microbiota changes at phylum (F) and family (G) level. (H) Targeted functional quantitative PCR analysis of microbial genes. Kruskal-Wallis test. Copy number per ng DNA was calculated in each group and the relative changes to 5-month-old male mice were shown. n=6–8 per group. *, P<0.05; **, P<0.01; ***, P<0.001. baiJ, bile acid inducible operon gene J; bsh, bile salt hydrolase.

