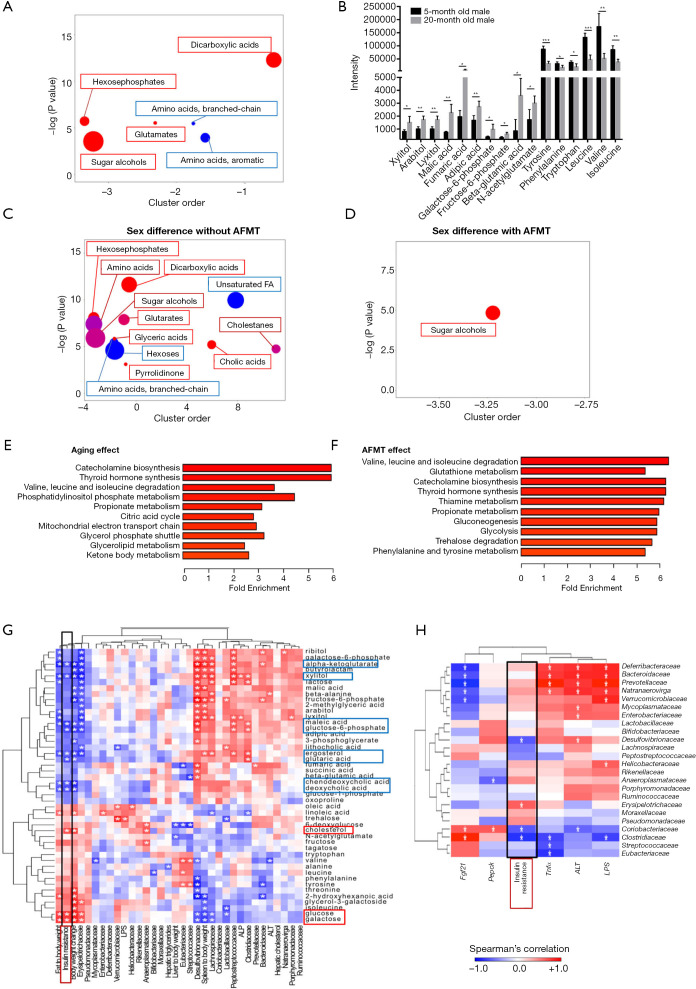
Figure 5.
Untargeted metabolomics study of aged male fecal microbiota transplantation (AFMT) and Spearman’s correlation between metabolites, phenotypes, and bacterial family. ChemRICH metabolite set enrichment statistics plot (A) and the intensity of metabolites detected by GC-TOFMS (B) in 5- and 20-month-old male mice. The node color shows increased (red) or decreased (blue) metabolite sets in 20-month-old compared to 5-month-old mice (A). The node sizes represent the total number of metabolites in each cluster set. ChemRICH metabolite set enrichment statistics plot showed sex difference in metabolite set without (female control vs. male control) (C) and with AFMT (female + AFMT vs. male + AFMT) (D). Metabolite set enrichment analysis due to aging effect (5-month-old male vs. 20-month-old male) (E) and AFMT effect (5-month-old male with and without aged fecal microbiota transplantation) (F). n=4 per group. Data are expressed as mean ± SD. Student’s t-test. *, P<0.05; **, P<0.01; ***, P<0.001. GC-TOFMS, gas chromatography time-of-flight mass spectrometry. (G) Spearman’s correlation analysis of metabolites with phenotypes and bacterial families. (H) Spearman’s correlation analysis of bacterial families with phenotypes and hepatic gene expression.

