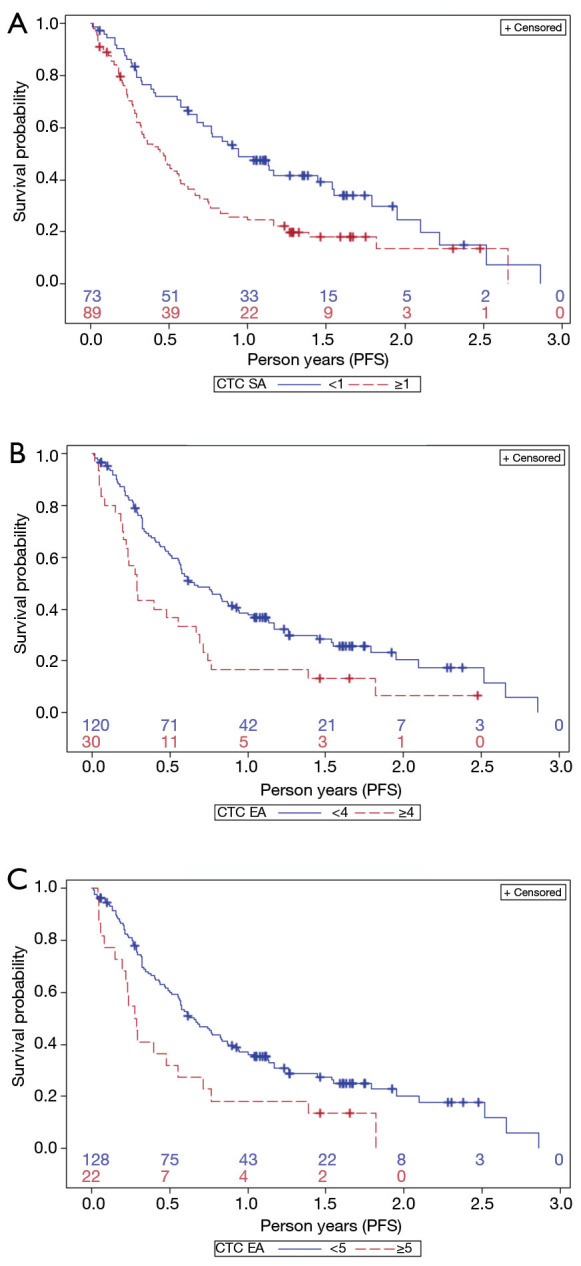
Figure 3.

Prediction of progression-free survival (PFS) based on circulating tumour cell (CTC) count as determined by SA (A) using 1 CTC as cut-off. Prediction of PFS using EA with 4 CTCs (B) and 5 CTCs (C) as cut-off value. (A) Kaplan-Meir curves identify two groups of patients with favourable (blue line) or unfavourable (dotted red line) prognosis, depending on CTC <1 or ≥1 cells/7.5 mL PB, enumerated by SA (Log Rank test P=0.002); (B) Kaplan-Meir curves identify two groups of patients with favourable or unfavourable prognosis, depending on CTCs <4 or ≥4 cells/7.5 mL PB, enumerated by EA (Log Rank test P=0.004); (C) Kaplan-Meir curves identify two groups of patients with favourable or unfavourable prognosis, depending on CTCs <5 or ≥5 cells/7.5 mL PB, enumerated by EA (Log Rank test P=0.007).
