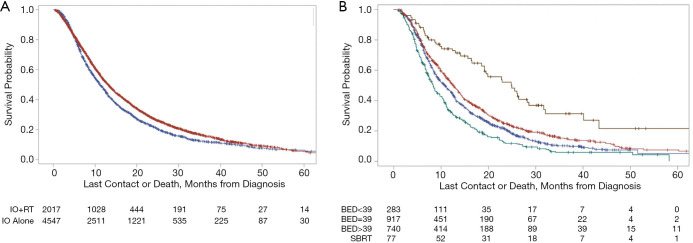
Figure 3.
Kaplan-Meier regression analysis. (A) Survival analysis comparing patients who received radiotherapy and immunotherapy (blue) with immunotherapy alone (red) (log-rank test, P<0.0001). (B) Survival analysis comparing patients who received radiotherapy stratified by BED <39 (green), BED =39 (blue), BED >39 (red), and SBRT (brown) (log-rank test, P<0.0001). BED, biologically effective dose.

