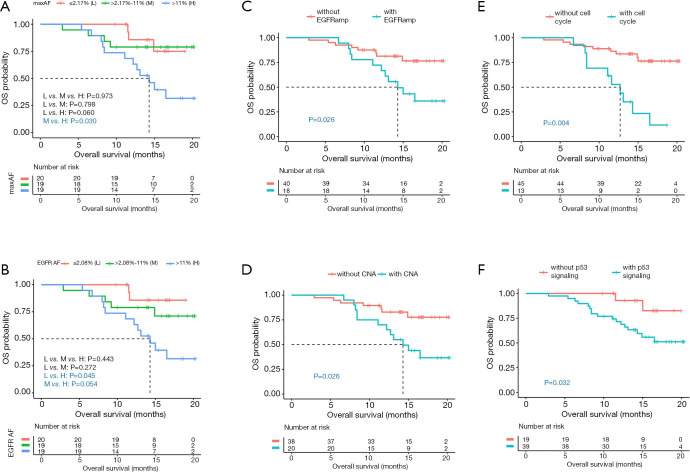
Figure 1.
Certain molecular features at baseline including (A) maxAF; (B) AF of EGFR sensitizing mutations; and concurrent alterations such as (C) EGFR amplification, (D) copy number amplifications, and genes involved in the (E) cell cycle and (F) TP53 signaling pathway are associated with significantly shorter OS. (A,B) Red line represents patients with low (L)-level maxAF or AF (n=20). Green line represents patients with medium (M)-level maxAF or AF (n=19). Blue line represents patients with high (H)-level maxAF or AF (n=19). (C,D,E,F) Red line represents patients without the indicated concurrent mutation. Blue line represents patients with indicated concurrent mutation. Dotted line indicates the median OS. The risk table below illustrates the number of patients included per time point.

