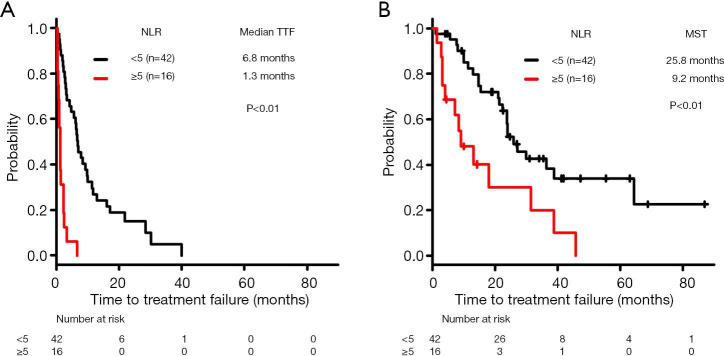
Figure 4.
Kaplan-Meier curves of time to treatment failure (TTF) and overall survival (OS) in patients with wildtype non-small cell lung cancer treated with immune checkpoint inhibitors after first-line setting. Comparison of (A) TTF and (B) OS according to neutrophil-to-lymphocyte ratio. NLR, neutrophil-to-lymphocyte ratio; MST, median survival time.

