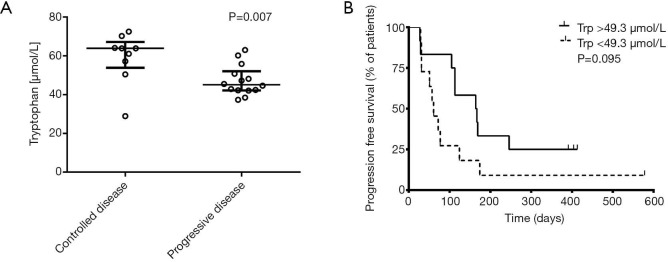
Figure 5.
Tryptophan (Trp) levels before treatment start. (A) Median baseline Trp levels in patients with controlled disease (partial response and stable disease) compared to patients with primary refractory disease (median Trp levels controlled disease vs. primary refractory 63.8 vs. 45.0 µmol/L, P=0.007). (B) Kaplan-Meier plot showing progression free survival in the whole cohort with stratification according to Trp levels at baseline (the cut-off at Trp 49.3µmol/L was established according to ROC analysis). A trend towards improved progression-free survival (PFS) was observed in patients with Trp levels ≥49.3 µmol/L [PFS ≥49.3 vs. <49.3 µmol/L: 164 vs. 61 days (HR 0.47; 0.19–1.18), P=0.095].

