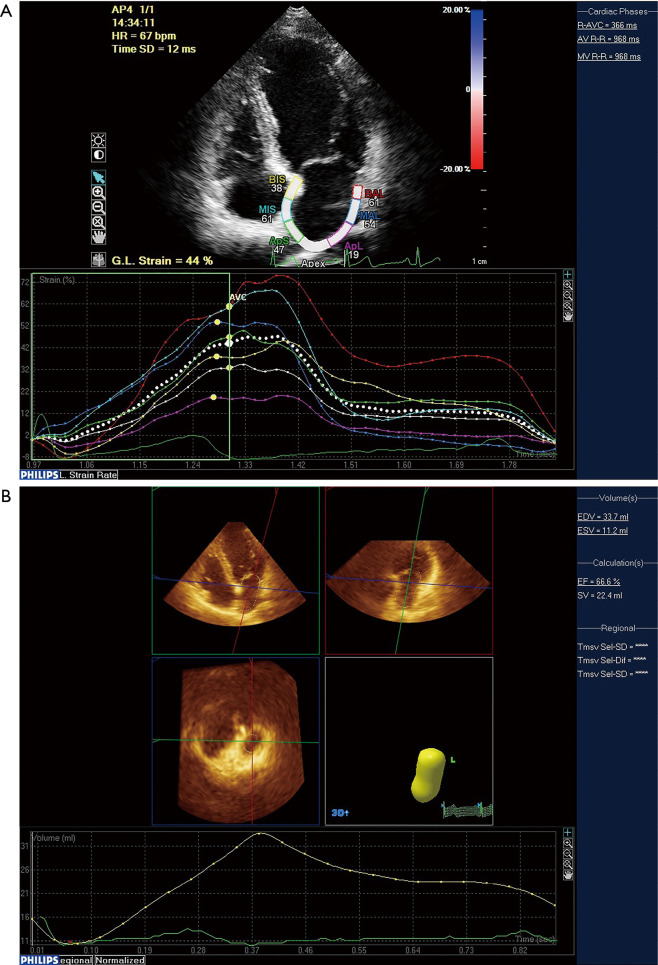
Figure 1.
Examples of image analysis in the QLAB workstation. (A) The left atrial strain and strain rate curves were automatically analyzed in the aCMQ mode. (B) After entering the 3DQAdvance mode, a reference point was drawn from the roof of the apical two-chamber view, and left atrial time-volume curve was automatically drawn.

