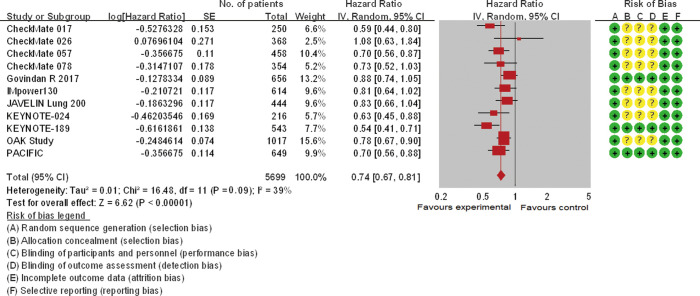
Figure 2.
The forest plot displayed overall survival (OS) of current/former smokers. The risk of bias mainly originated from allocation concealment, blinding of participants and personnel, and blinding of outcome assessment. And only mild heterogeneity existed across these studies. The pooled hazard ratio based on a random effect model showed a significant improvement of OS in the experimental group versus control group (P<0.00001).

