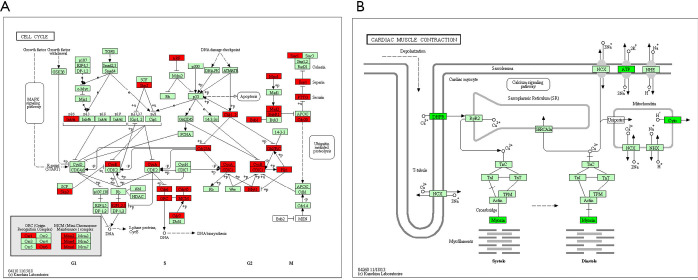
Figure 6.
The cell cycle pathway showed the most significant upregulation while the cardiac muscle contraction pathway showed the most significant downregulation in EXO1_high breast cancer patients. (A) The pathway mapping plot of cell cycle pathway. The red color indicated up-regulated genes and light green color indicated subpathways of cell cycle pathway; (B) The pathway mapping plot of cardiac muscle contraction pathway. The dark green color indicated down-regulated genes and light green color indicated subpathways of cardiac muscle contraction pathway.

