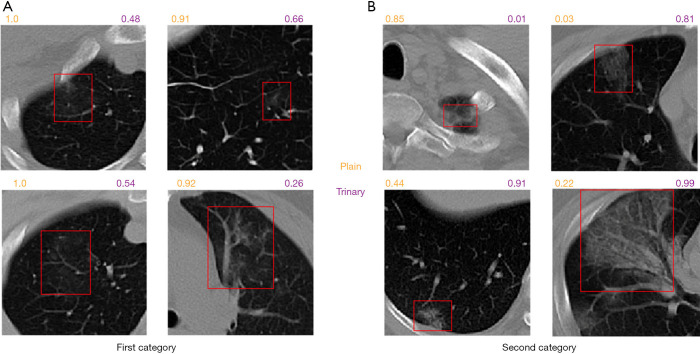
Figure 8.
Graphical examples for lesion classification on NCP patients from the external validation set. The numbers above each CT image patch represent the predicted probabilities of being NCP by the Plain scheme (orange) and the Trinary scheme (purple), respectively. (A) presents 4 detected lesions in the first category (20 NCP patients from hospital 1–3). On the 4 non-typical NCP lesions, the Plain scheme gave much higher probability than the Trinary scheme did. (B) presents 4 detected lesions on the second category (37 NCP patients from hospital 4–8). The top left lesion is a false positive. CT, computed tomography; NCP, novel coronavirus pneumonia.

