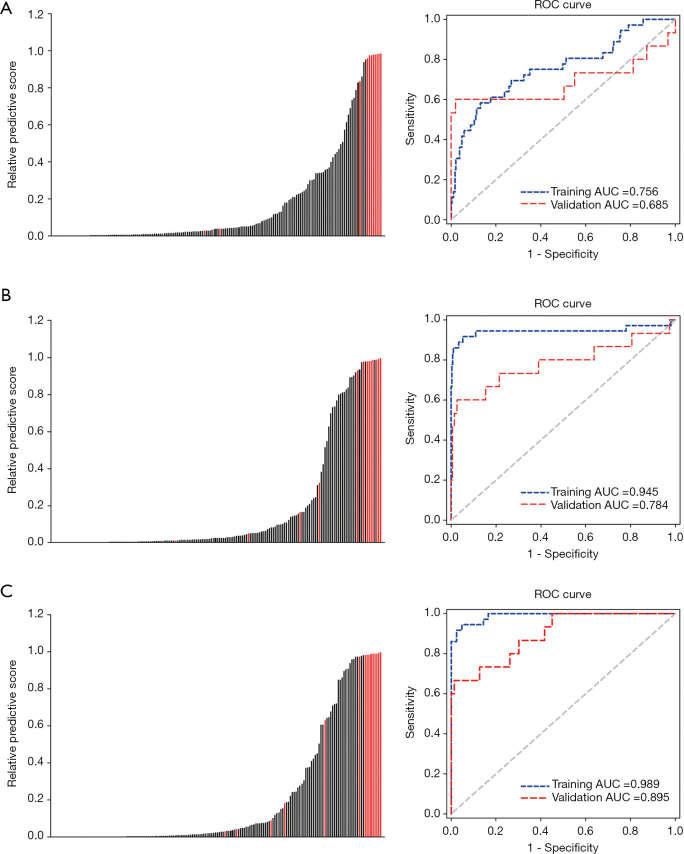
Figure 5.
A comparison of the diagnostic performance of the three models. (A) Left, the predictive scores of the RC model for each patient in the validation cohort. Right, the ROC curve of the RC model in the training and validation cohorts. (B) Left, the predictive scores of the RI model for each patient in the validation cohort. Right, the ROC curve of the RI model in the training and validation cohorts. (C) Left, the predictive scores of the RIC model for each patient in the validation cohort. Right, the ROC curve of the RIC model in the training and validation cohorts. RI, radiomics imaging; RC, radiomics clinical; RIC, radiomics imaging and clinical; ROC, receiver operating characteristic.

