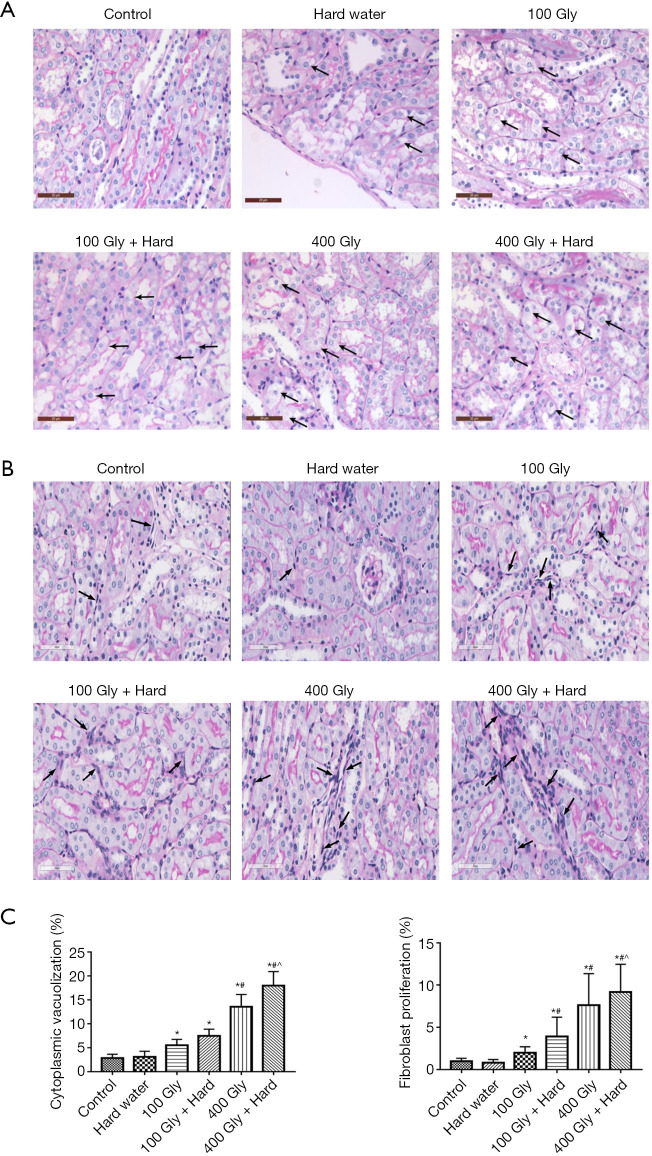
Figure 3.
PAS-stained sections. (A) Vacuolar degeneration in epithelium cells, bar =20 µm, black arrows show cytoplasmic vacuolization; (B) proliferation of interstitial fibroblasts, bar =60 µm, black arrows show fibroblast hyperplasia; (C) quantification of pathology. *, P<0.05 compared with controls; #, P<0.05 compared with 100 mg/kg glyphosate; ^, P<0.05 compared with 400 mg/kg glyphosate. Gly, glyphosate; PAS, periodic acid-schiff.

