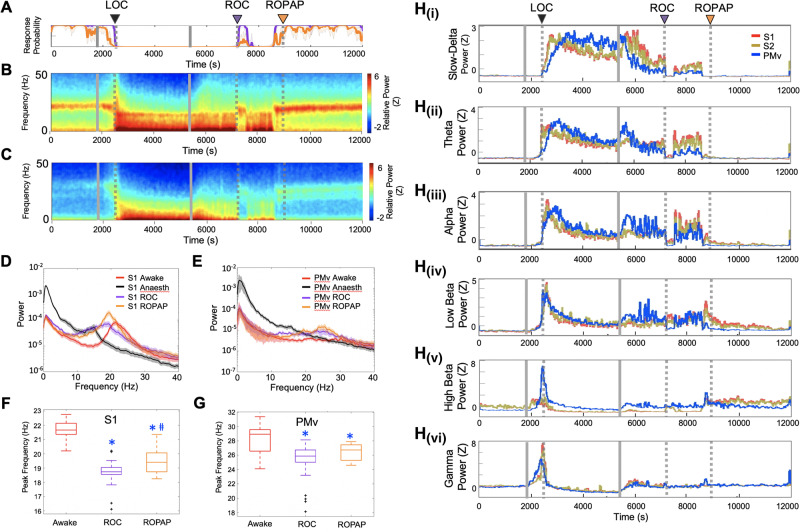
Figure 2.
Return of the beta oscillations and decline of the slow-delta oscillations are associated with ROC. (A) Behavioural response. (B) LFP spectrograms in S1. (C) LFP spectrograms in PMv. (D) Power spectrum in S1. (E) Power spectrum in PMv. The spectra are shown during wakefulness (Awake), anaesthesia (the last 15 min of propofol infusion), ROC and ROPAP. (F) Peak frequencies of the beta oscillations in S1; 21.7 ± 0.1 Hz in awake, 18.8 ± 0.1 Hz at ROC, 19.4 ± 0.1 Hz at ROPAP (mean ± SE). An asterisk indicates a significant difference from the awake state [one-way Kruskal-Wallis for S1: χ2(2) = 220.0, P = 1.68 × 10−48, post hoc Dunn-Sidak test, P < 0.001]. A hash symbol indicates a significant difference from ROC (P = 0.015). Outliers are shown with a black cross. (G) Peak frequencies in PMv; 28.0 ± 0.2 Hz in awake, 25.4 ± 0.3 Hz at ROC, 26.4 ± 0.1 Hz at ROPAP (mean ± SE). An asterisk indicates a significant difference from the awake state [one-way Kruskal-Wallis for PMv: χ2(2) = 50.06, P = 1.35 × 10⁻¹¹, post hoc Dunn-Sidak test, P < 0.001]. Outliers are shown with a black cross. (H) Change of the power in slow-delta [0.5–4 Hz, H(i)], theta [4–8 Hz, H(ii)], alpha [8–12 Hz, H(iii)], low beta [12–18 Hz, H(iv)], high beta [18–25 Hz, H(v)], low gamma [25–34 Hz, H(vi)] for S1 (red), S2 (brown) versus PMv (blue). Power was normalized using z-scores. Propofol was infused for 60 min (1800–5400 s, grey solid lines in A–C, and H). LOC is shown with a black arrow and dotted lines, ROC with a purple arrow and dotted lines, and ROPAP with an orange arrow and dotted lines (A–C, and H).

