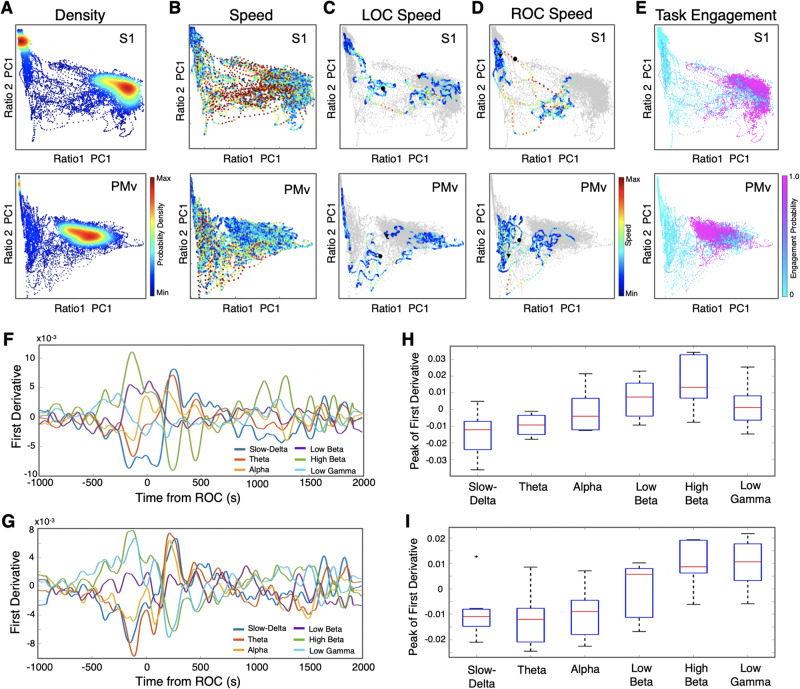
Figure 3.
Clusters in 2D state space correspond to distinct behavioural states and the state transitions are rapid. (A) Density plots. The density was calculated from the scatter plots that were created using two chosen LFP spectral amplitude ratios. Each dot corresponds to a 1-s window for which the amplitude ratios were calculated through the course of wakefulness, anaesthesia and recovery (one recording session of 4.5 h is displayed). (B) Speed plots. The plots represent the average velocity of spontaneous trajectories within the 2D state space. (C) Speed plots during LOC. The plots are shown for the 20-min period around LOC (10 min before and 10 min after LOC). A black circle indicates the time of LOC and a triangle indicates the start dot of the 20 min. (D) Speed plots during ROC. The plots are shown for the 20 min around ROC (10 min before and 10 min after ROC). A black circle indicates the time of ROC and a triangle indicates the start point of the 20 min. (E) Task engagement. The plots are colour coded according to the task engagement probability. Each cluster corresponds to a distinct state, high engagement, or low or no engagement. (F and G) First derivatives for each frequency band. The first derivatives (dy/dx) were computed for the average power within each frequency band centred on ROC (1000 s before and 2000 s after) for S1 (F) and PMv (G): slow-delta (0.5–4 Hz), theta (4–8 Hz), alpha (8–12 Hz), low beta (12–18 Hz), high beta (18–25 Hz), and low gamma (25–34 Hz). (H and I) Peak of the first derivatives. The peak of the first derivatives, either positive or negative, were computed to indicate the maximum rate of change within each frequency band of interest in a window immediately preceding ROC for S1 [Kruskal-Wallis χ2(5) = 24.7, P = 1.58 × 10⁻⁴; H] and PMv [Kruskal-Wallis χ2(5) = 28.2, P = 3.29 × 10⁻⁵; I]. In S1, peak of low beta is significantly higher than slow-delta (post hoc Tukey-Kramer test, P < 0.018; H). Peak of high beta is significantly higher than slow-delta (P = 0.0006; H) and theta (P = 0.0045; H). In PMv, peak of both high beta and low gamma are significantly higher than slow-delta, theta, and alpha in PMv (post hoc Tukey-Kramer test, all P < 0.02; I).

