Figure 4.
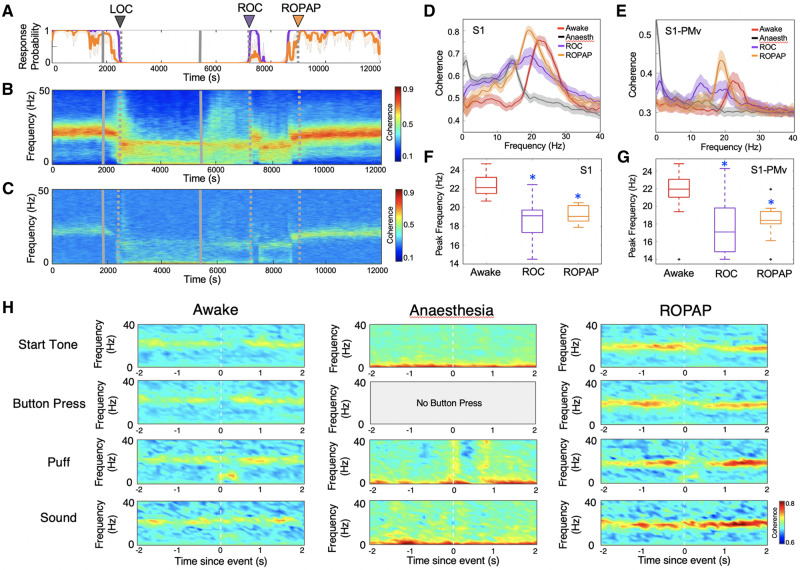
Beta oscillations are interregionally coherent at ROC and the coherence further increases at ROPAP. (A) Behavioural response. (B) LFP coherence time-frequency plot in S1. (C) LFP coherence time-frequency plot between S1 and PMv. (D) Coherence within S1 at awake (before anaesthesia start, red trace), anaesthesia (before the end of anaesthesia infusion, black trace), immediately following ROC (purple trace) versus immediately following ROPAP (orange trace). Coherence was averaged for a 1-min period for each epoch. Lines are shown with shaded standard error bands. (E) Coherence between S1 and PMv at awake (before anaesthesia start, red trace), anaesthesia (before the end of anaesthesia infusion, black trace), immediately following ROC (purple trace) versus immediately following ROPAP (orange trace). Coherence was averaged for a 1-min period for each epoch. Lines are shown with shaded standard error bands. (F) Peak beta frequencies of the coherence within S1 at awake (before anaesthesia start, red trace), immediately following ROC (purple trace) versus immediately following ROPAP (orange trace) for 1 min. There is a significant effect of anaesthetic-induced altered states of consciousness (awake, ROC, and ROPAP) on the peak frequency [ANOVA F(2,42) = 22.8, P = 2.0 × 10⁻⁷]. An asterisk indicates a significant difference from the awake state (post hoc Turkey-Kramer test, P < 0.0001). (G) Peak beta frequencies of the coherence between S1 and PMv at awake (before anaesthesia start, red trace), immediately following ROC (purple trace) versus immediately following ROPAP (orange trace) for 1 min. There is a significant effect of anaesthetic-induced altered states of consciousness (awake, ROC, and ROPAP) on the peak frequency [ANOVA F(2,42) = 11.8, P = 8.8 × 10⁻⁵]. An asterisk indicates a significant difference from the awake state (post hoc Turkey-Kramer test, P < 0.005). Outliers are shown with a black cross. (H) Task-event related change in the coherence between S1 and PMv. The time frequency coherence plots are the average across trials for start tone (n = 100 trials), button press (n = 100 trials), puff stimulation (n = 49 trials) and sound stimulation (n = 37 trials). Each column represents different time epochs; immediately before anaesthesia start (Awake), immediately before anaesthesia end (Anaesthesia), and immediately following ROPAP. Propofol was infused for 60 min (1800–5400 s, grey solid lines in A–C). LOC is shown with a black arrow and dotted lines, ROC with a purple arrow and dotted lines, and ROPAP with an orange arrow and dotted lines in A–C.

