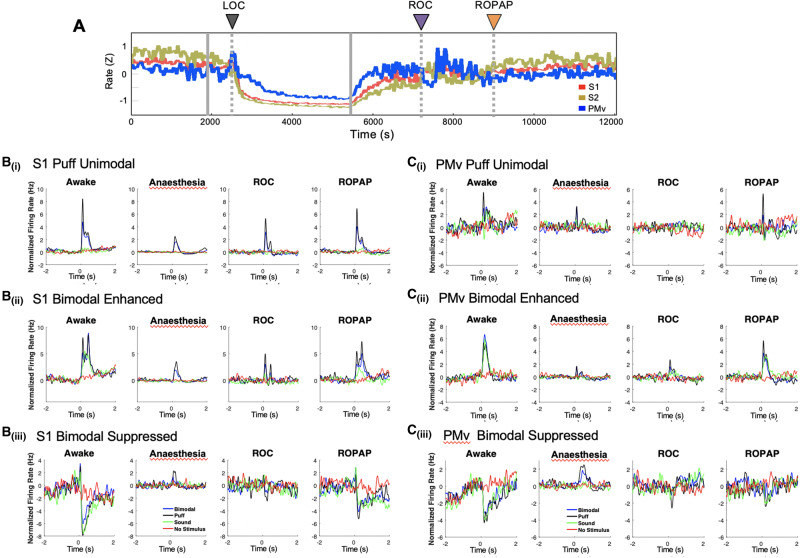
Figure 5.
Neuronal firing rate and multisensory responses in S1 and PMv. (A) Average baseline firing rates in S1, S2 and PMv. Firing rates were normalized using z-scores. (B) Peri-stimulus time histograms for S1 unimodal tactile-responsive neurons [B(i)], bimodal tactile and auditory responsive neurons [B(ii)], and bimodal neurons with suppressed firing rate response [B(iii)] during wakefulness, anaesthesia, ROC and ROPAP. (C) Peri-stimulus time histograms for PMv unimodal tactile-responsive neurons [C(i)]. Bimodal tactile and auditory responsive neurons [C(ii)], and bimodal neurons with suppressed firing rate response [C(iii)] during wakefulness, anaesthesia, ROC and ROPAP. LOC is shown with a black arrow and dotted lines, ROC with a purple arrow and dotted lines, and ROPAP with an orange arrow and dotted lines in A.

