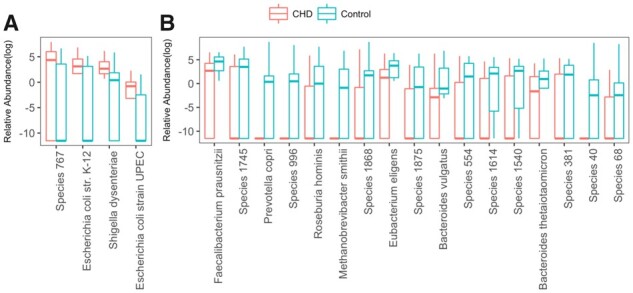
Fig. 12.

Relative abundance of identified species which have significant differences between CHD and control samples. Wilcoxon-rank sum test is used to test distribution difference between CHD and control group. Totally 21 species distributed significantly different in CHD and control group with 0.05 FDR that is calculated by Benjamin Hochberg method
