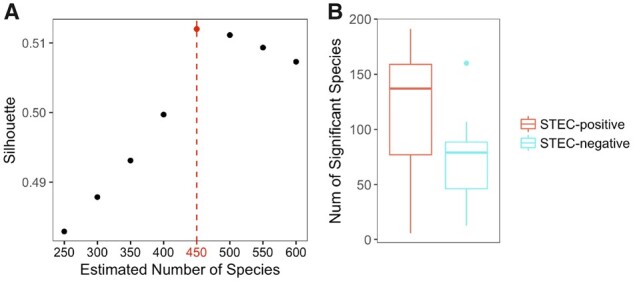
Fig. 9.

Plotted in (A) is the C(K) versus K. Because C(K) is maximized at 450, we let K = 450. In (B), we plot how the number of significant species distributed among 43 STEC-positive samples (left red boxplot) and 10 STEC-negative samples (right blue boxplot). (Color version of this figure is available at Bioinformatics online.)
