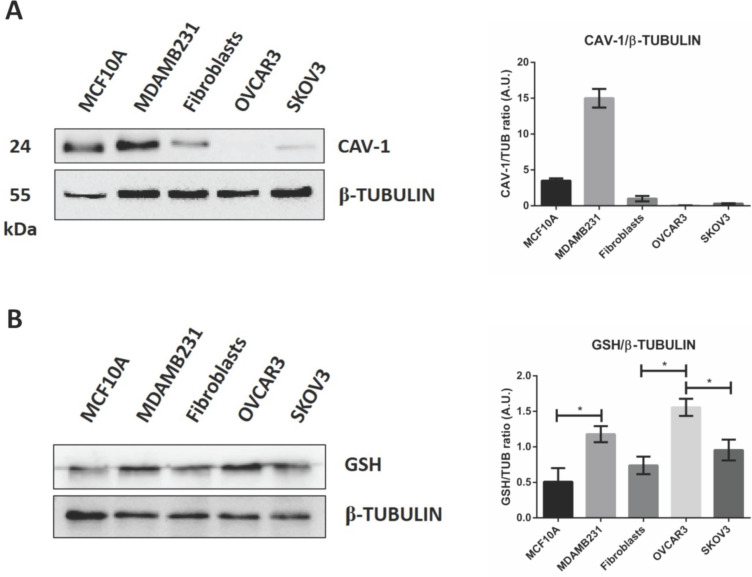
Figure 3.
GSH-NSs uptake is guided by intracellular GSH content. (A) Western blotting showing the expression of caveolin-1. For loading control, the membranes were re-probed with β-Tubulin. Graph representing the densitometric analysis shown as average (A.U., arbitrary units) ±SD. (B) Western blotting to assess intracellular GSH content in cell models. For loading control, the membranes were re-probed with β-Tubulin. Graphs representing the densitometric analysis of three independent experiments are shown. Data are presented as average (A.U., arbitrary units) ±SD. Significance was considered as follows: *p < 0.05.

