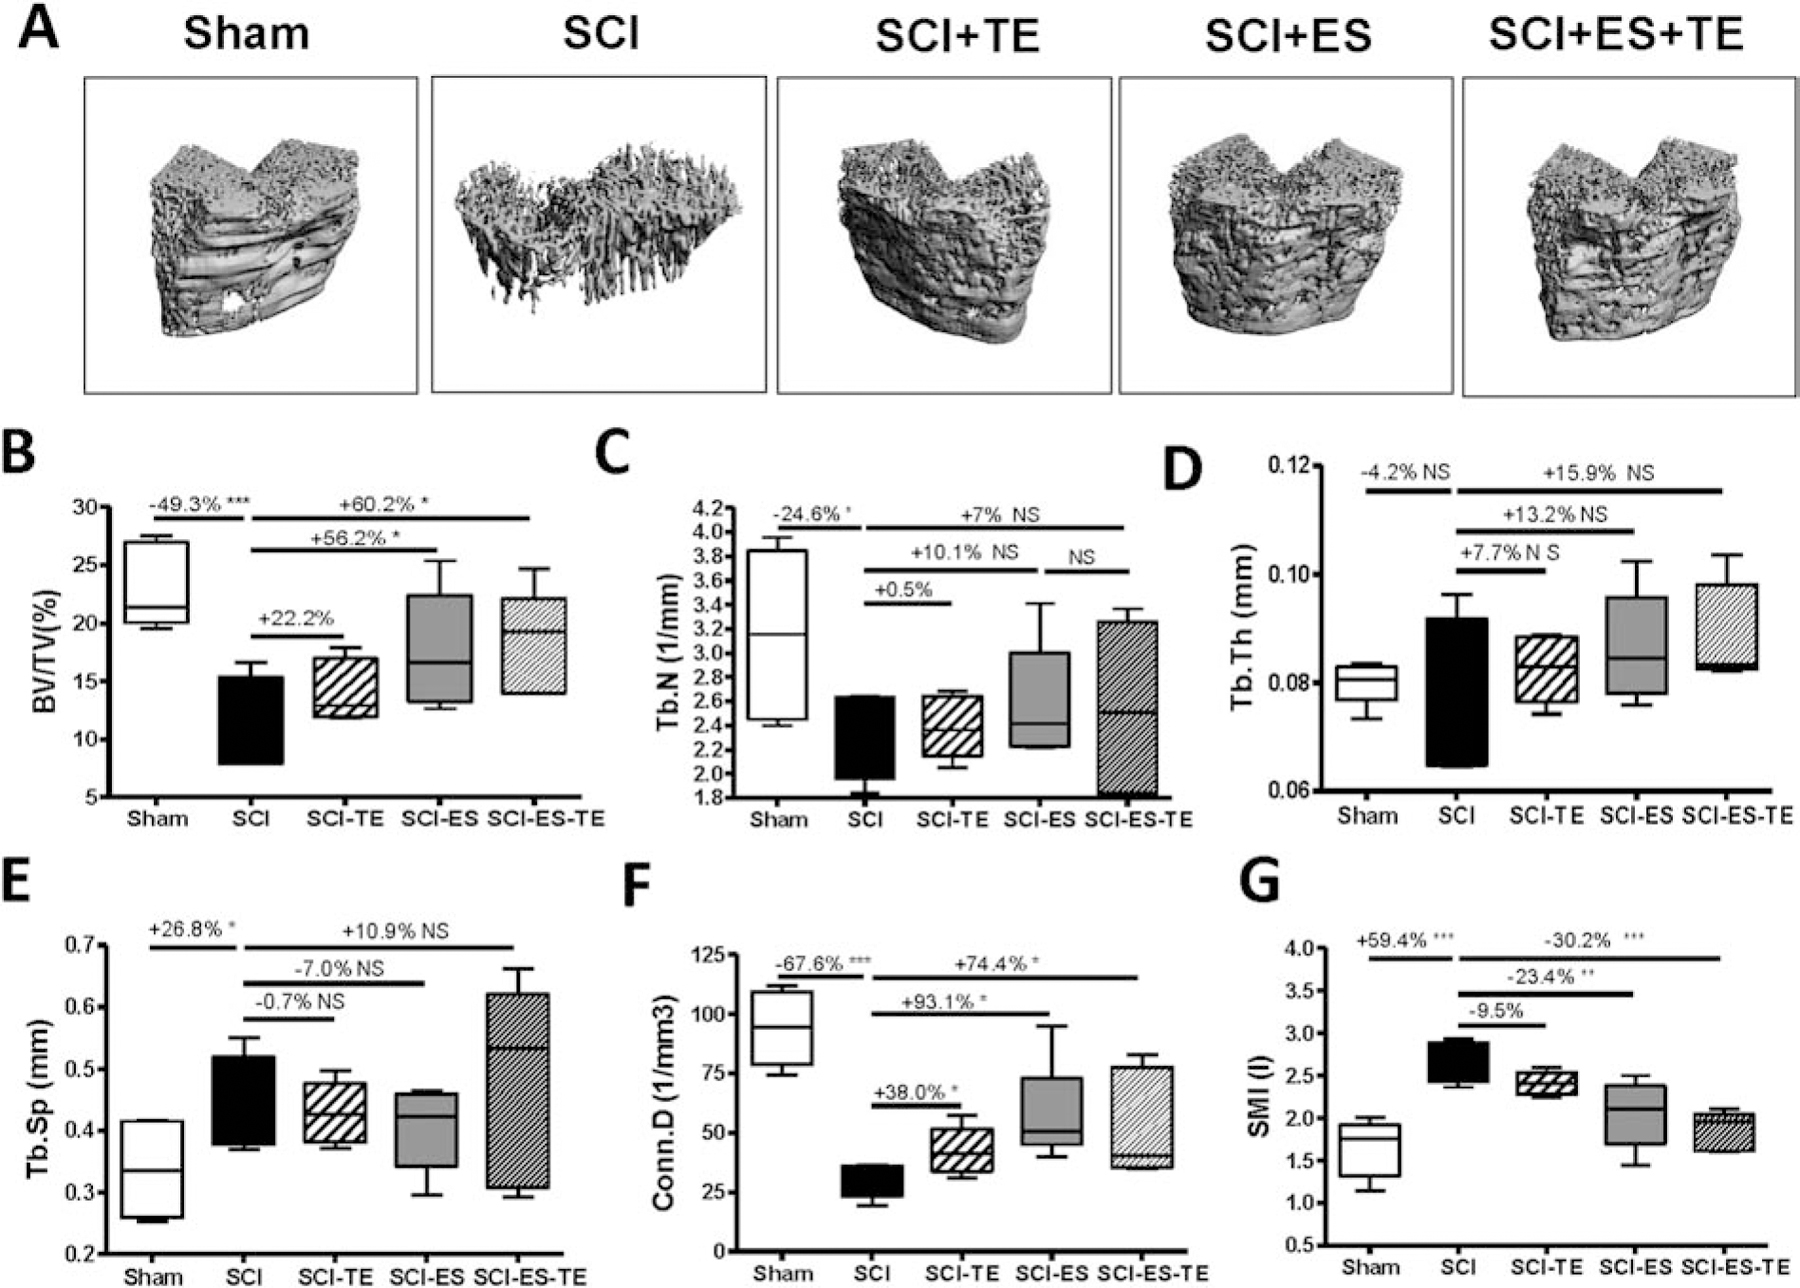
Figure 3. Effects of ES or ES+TE on trabecular architecture of the distal femur.

(A–F) Parameters of trabecular architecture: (A) representative μCT 3D images of trabecular microarchitecture; (B) trabecular bone volume per total volume (BV/TV%), (C) trabecular number (Tb.N), (D) trabecular thickness (Tb.Th), (E) trabecular space (Tb.Sp), (F) connectivity density (Conn.D), and (G) structure model index (SMI). Data are expressed as mean ± SE. N = 6 – 8 per group. Significance of differences was determined by using one-way ANOVA with a Newman–Keuls post hoc test. *P < 0.05, **P < 0.01 and ***P < 0.001 versus the indicated group.
