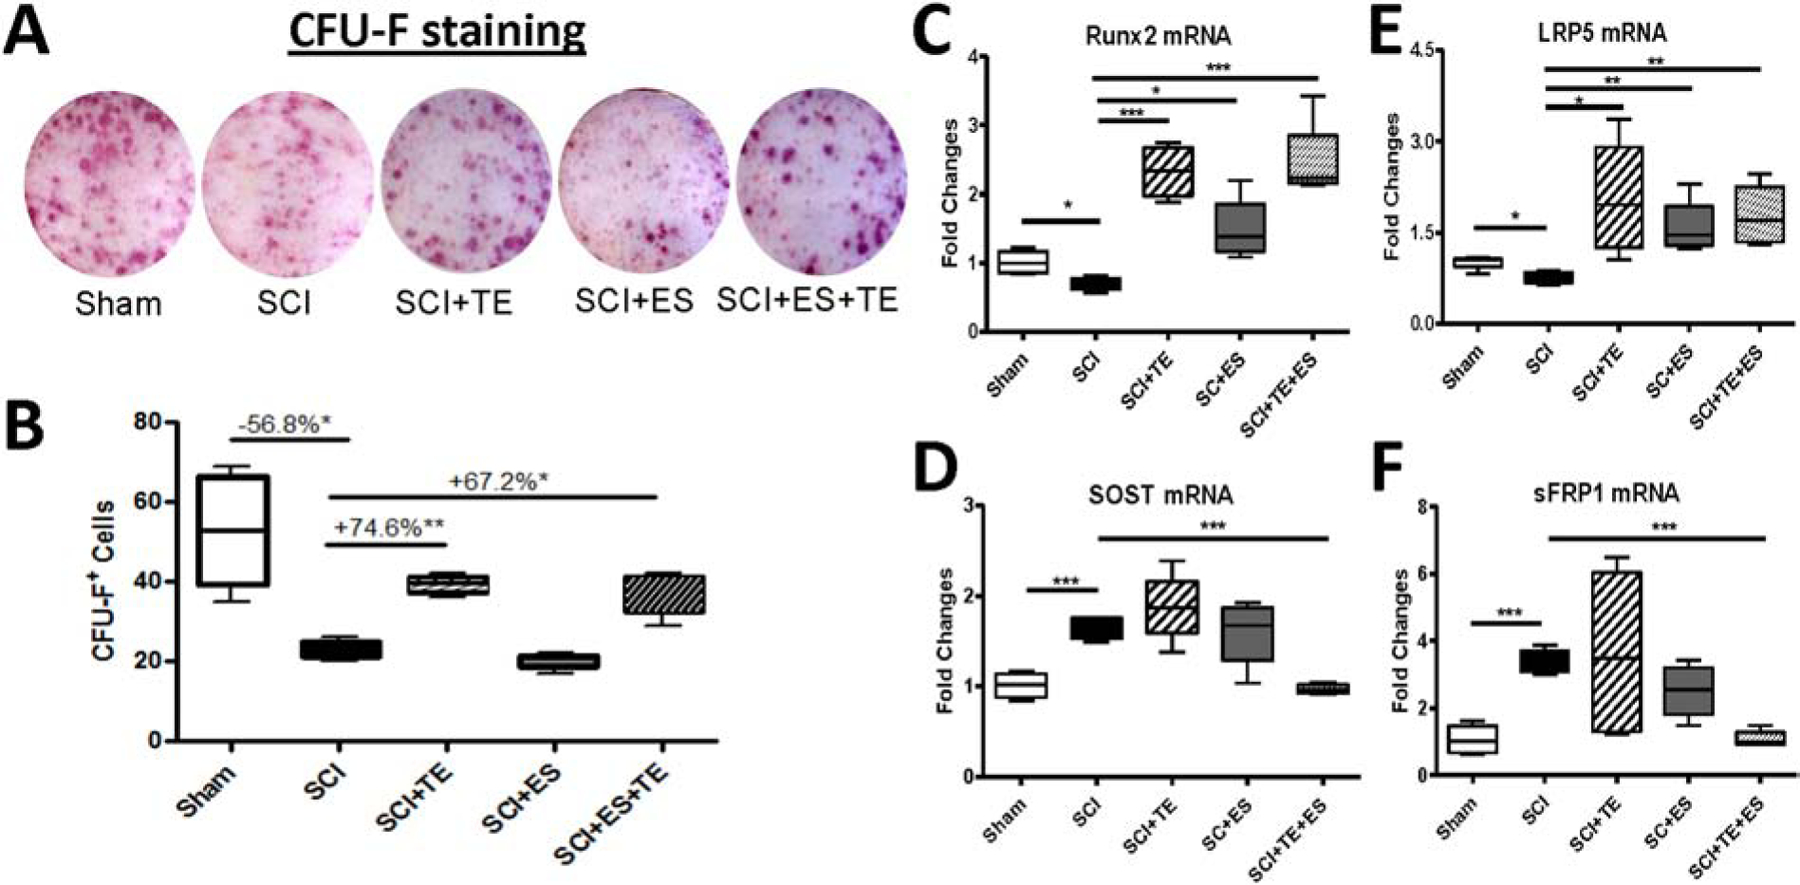
Figure 8. Effects of ES or ES+TE treatment on osteoblastic differentiation.

(A–B) Representative images of bone formation: (A) alkaline phosphatase staining (CFU-F) of cultured bone marrow stromal cells, and (B) quantification of CFU-F+ cells. (C–F) Changes in the gene expression of bone formation markers in cultured bone marrow stromal cells by quantitative PCR: (C) Runx2, (D) sclerostin (SOST), (E) LRP5, and (F) sFRP1. *p<0.05, ***p<0.001 by one-way ANOVA plus Newman–Keuls post hoc test, n=6–8 per group.
