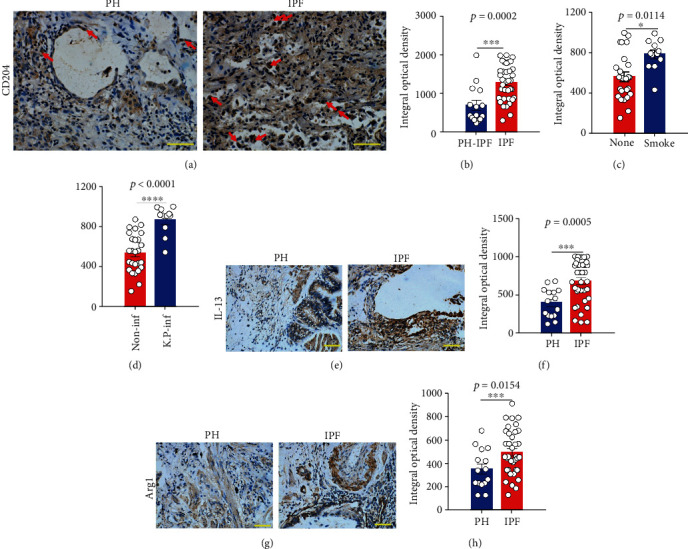
Figure 2.

The expression of MSR1 in the lung tissue samples from PAH and IPF patients. (a) Representative figure of MSR1 expression in the fibrotic lung in the samples from a PAH or IPF patient. Bar: 100 μm. (b) The mean optical density of MSR1-positive cells between PAH and IPF subjects was digitized and analyzed on Image-Pro Plus software. (c) The mean optical density of MSR1-positive cells in IPF subjects with (smoke) or without (none) smoke was analyzed. (d) The mean optical density of MSR1-positive cells in IPF subjects with (K.P-inf, n = 11) or without Klebsiella pneumoniae infection (non-inf, n = 26) was analyzed. (e, f) Representative figure of the expression of IL-13 and arginase-1 (Arg1) in the fibrotic lung in the samples from a PAH or IPF patient. Bar: 100 μm. (g, h) The mean optical density of IL-13- and Arg1-positive cells between PAH and IPF subjects was digitized and analyzed on Image-Pro Plus software. Data are expressed as the mean ± SEM for each group, PAH, n = 15; IPF, n = 37. ∗p < 0.05 and ∗∗∗p < 0.001 (Student's t-test).
