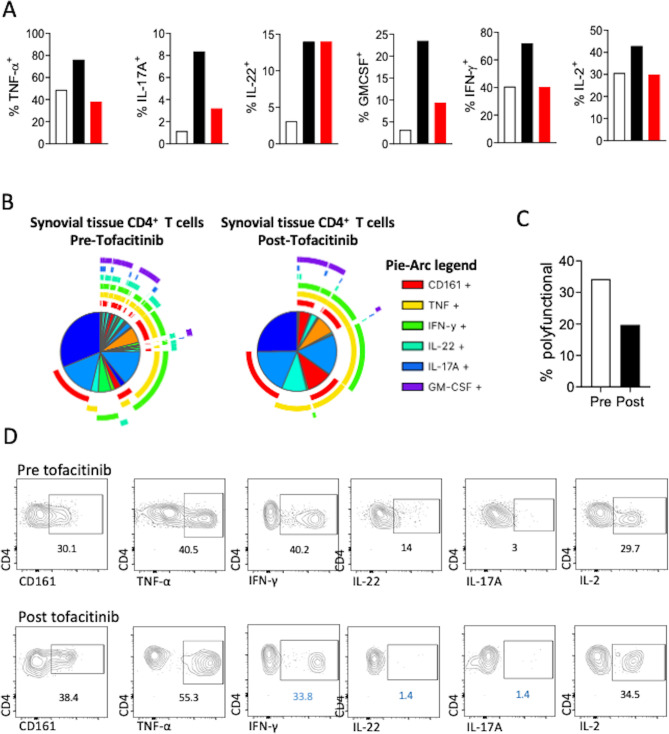
Figure 3.
Analysis of synovial tissue T cell polyfunctionality using SPICE algorithm. Flow cytometric analysis for the frequency of key proinflammatory cytokine-producing synovial tissue CD4 T cells pretreatment and post-treatment with tofacitinib. Frequencies in red denote increase and frequencies highlighted in blue, decrease in the corresponding proinflammatory cytokine post tofacitinib treatment compared with pretreatment responses (A). Following polyparametric flow cytometric analysis of synovial tissue derived T cells, the supervised data visualisation algorithm SPICE was used (B). The pie segments represent the percentage of cells and the pie arcs the cytokine or marker that is being expressed. Pie segments surrounded by overlapping pie arcs denote CD4 T cell populations expressing multiple cytokines simultaneously. Data presented for synovial tissue CD4 T cells at first arthroscopy—prior to the initiation of tofacitinib treatment and second arthroscopy—post tofacitinib treatment. Frequency of polyfunctional synovial tissue CD4 T cells expressing more than three proinflammatory cytokines simultaneously at time of first and second arthroscopy (C).

