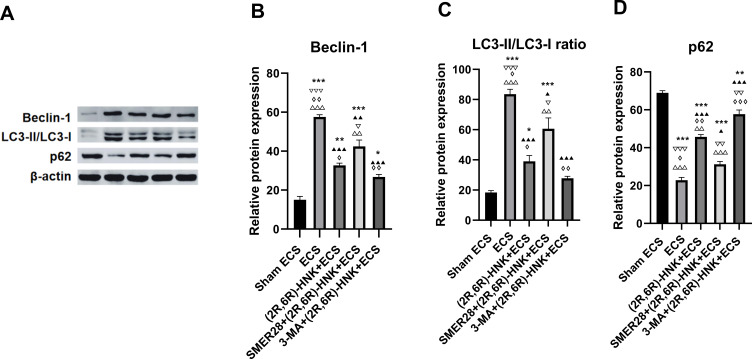
Figure 3.
Western blot analysis of Beclin-1, LC3-II/LC3-I ratio and p62 expression in the hippocampus. (A) Western blot analysis; (B) expression of Beclin-1; (C) ratio of LC3-II/LC3-I; (D) expression of p62. *P<0.05, **P<0.01, ***P<0.001 compared with the sham ECS group. ▲P<0.05, ▲▲P<0.01, ▲▲▲P<0.001 compared with the ECS group. ▽P<0.05, ▽▽P<0.01, ▽▽▽P<0.001 compared with the (2R,6R)-HNK+ECS group. ◊P<0.05, ◊◊P<0.01, ◊◊◊P<0.001 compared with the SMER28+(2R,6R)-HNK+ECS group. ΔΔP<0.01, ΔΔΔP<0.001 compared with the 3-MA+(2R,6R)-HNK+ECS group. Data were analyzed using one-way analysis of variance, with the Bonferroni post hoc test. Bars represent the means ± SEMs; n=3 per group.
Abbreviations: ECS, electroconvulsive shock; (2R,6R)-HNK, (2R,6R)-hydroxynorketamine; 3-MA, 3-methyladenine; SMER28, small-molecule enhancer of rapamycin 28; LC, light chain.

