
FIGURE 1.
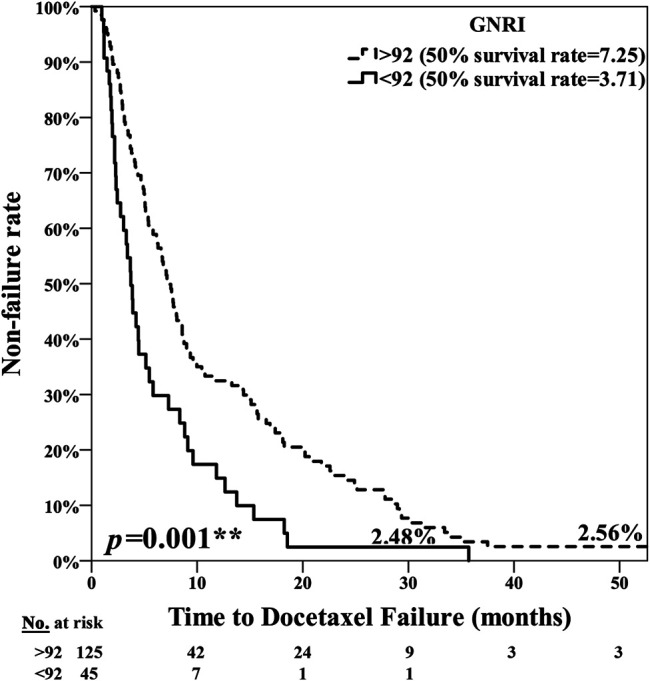
Kaplan-Meier curve for PSA Progression Free Survival (PFS) among the normal nutrition group (GNRI ≥92.0) and poor nutrition group (GNRI <92.0), median 7.25 months vs. 3.71 months, respectively (p = 0.001**).
Official websites use .gov
A
.gov website belongs to an official
government organization in the United States.
Secure .gov websites use HTTPS
A lock (
) or https:// means you've safely
connected to the .gov website. Share sensitive
information only on official, secure websites.
Kaplan-Meier curve for PSA Progression Free Survival (PFS) among the normal nutrition group (GNRI ≥92.0) and poor nutrition group (GNRI <92.0), median 7.25 months vs. 3.71 months, respectively (p = 0.001**).