Figure 2.
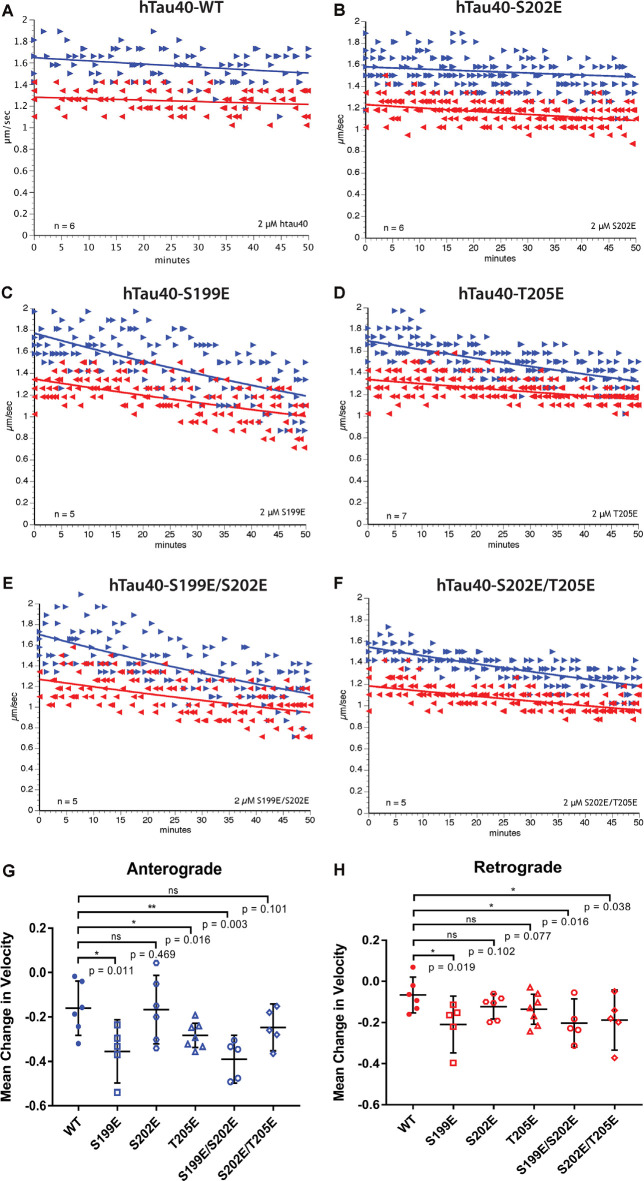
Differential phosphorylation of tau within the AT8 epitope can inhibit either anterograde or both directions of fast axonal transport (FAT). (A–F) The vesicle motility assay in isolated squid axoplasm is an ex vivo model system that allows for simultaneous, quantitative analysis of anterograde and retrograde FAT (Song et al., 2016). Graphs are plotted as velocity (μm/s) against time with right arrows ($▸$) indicating anterograde data points and left arrows ($◂$) indicating retrograde data points. (A) Perfusion of WT tau monomers did not affect the rate of axonal transport in either the anterograde or retrograde direction. (B) hTau40-S202E monomers were not sufficient to inhibit FAT in either the anterograde or retrograde directions. (C) In contrast, Tau monomers pseudophosphorylated at serine 199 (hTau40-S199E) inhibited FAT in both directions, whereas (D) pseudophosphorylation of tau monomers at threonine 205 (hTau40-T205E) selectively inhibited anterograde FAT. (E) Pseudophosphorylation of tau monomers at serine 199 and serine 202 (hTau40-S199E/S202E) inhibited FAT in both directions whereas (F) tau monomers pseudophosphorylated at serine 202 and threonine 205 (hTau40-S202E/T205E) inhibited retrograde FAT with a trend towards inhibition of anterograde FAT. (G) Quantitative analysis of FAT demonstrated that S199E (n = 5; p = 0.011), T205E (n = 7; p = 0.016), and S199E/S202E (n = 5; p = 0.003) significantly inhibited anterograde FAT compared to hTau40-WT (n = 6). By contrast, S202E (n = 6, p = 0.469) and S202E/T205E (n = 5; p = 0.101) were not significantly different from hTau40-WT, although anterograde FAT showed a tendency for reduction with S202E/T205E that may become significant after longer incubation. (H) Compared to hTau40-WT, retrograde FAT was significantly inhibited by S199E (n = 5; p = 0.019), S199E/S202E (n = 5; p = 0.016), and S202E/T205E (n = 5; p = 0.038) but was unaffected by S202E (p = 6; p = 0.102) and T205E (n = 7; p = 0.077). All scatter plots are presented as mean ± 95% confidence interval.

