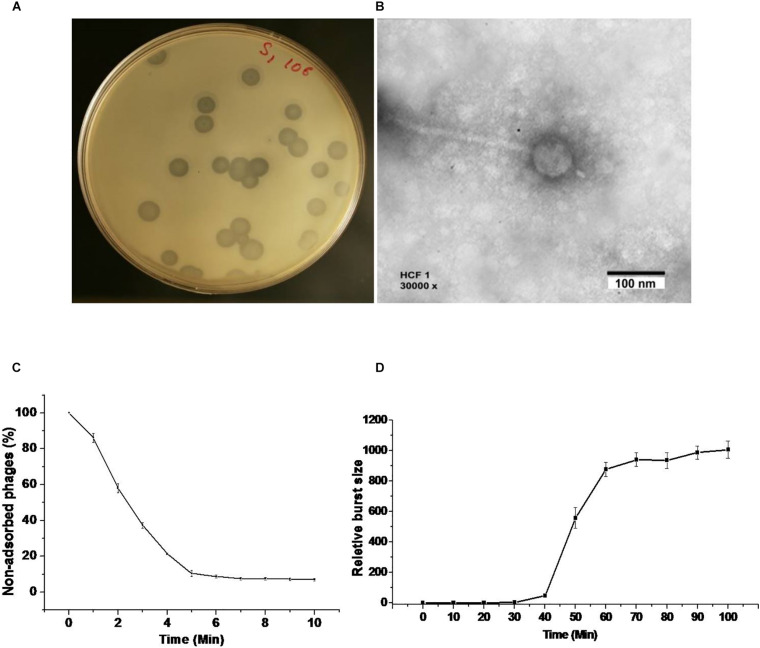
FIGURE 1.
Morphology, adsorption rate, and one-step growth curve of bacteriophage HCF1. (A) Bacteriophage plaque in double agar plating assay. (B) Transmission electron micrograph. (C) The rate of adsorption of bacteriophage to the C. amalonaticus NAIMCC 1364 host. Bacteriophages were added to the bacterial suspension at an MOI:0.1. The percentage of non-adsorbed bacteriophages was calculated at the indicated time points. The presented data are means of three independent experiments with error bars showing the standard error of mean (SEM). (D) One-step growth curve analysis of bacteriophage HCF1. Plaque-forming units (PFU) were estimated at different intervals post infection against host bacterium C. amalonaticus. Bars represent SEM.

