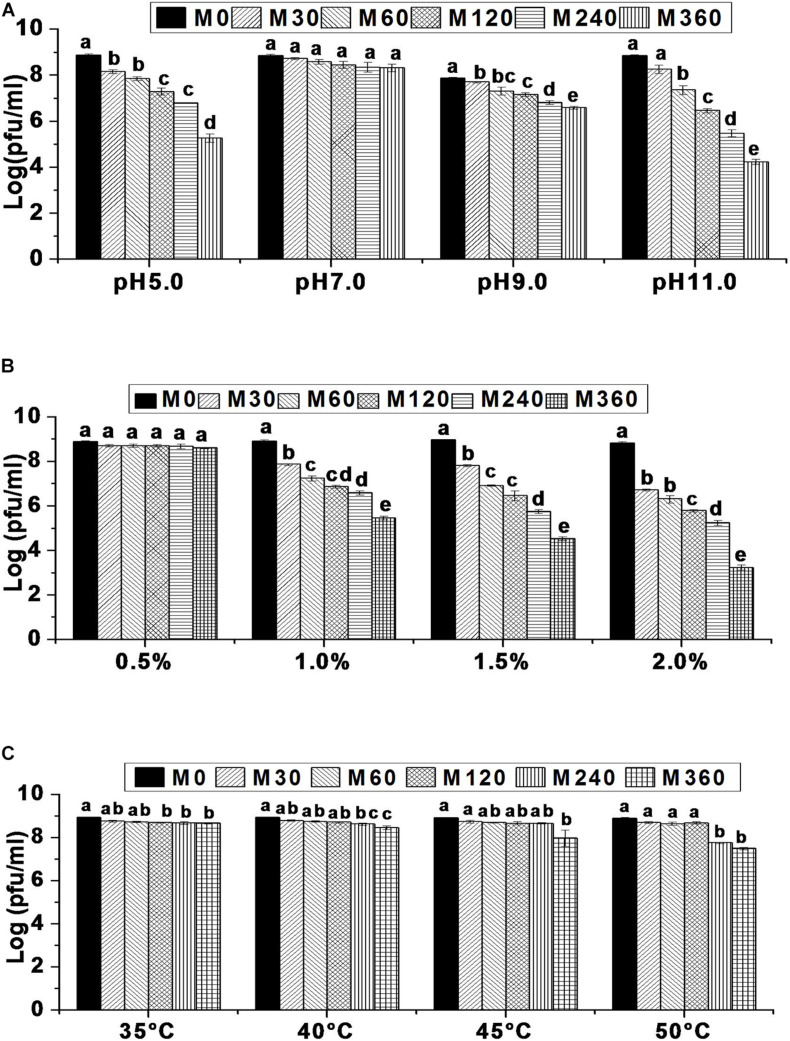
FIGURE 3.
Environmental stress tolerance of bacteriophage HCF1. (A) pH stability. (B) NaCl tolerance. (C) Thermal stability. Error bars represent standard error of mean (n = 3). Values of a given bacteriophage depicted as column without common letter differ significantly at p ≤ 0.05 as per Tukey’s HSD test. Letter “M” represents the experimental duration in minutes.

