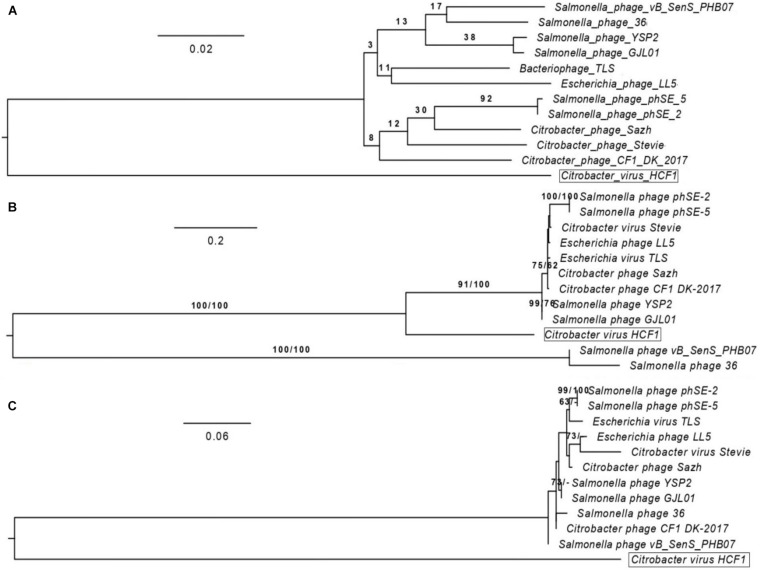
FIGURE 5.
Phylogenomic comparison of bacteriophage HCF1 with 11 closely related members of Drexlerviridae. The numbers above branches are pseudo-bootstrap support values from 100 replications. The branch lengths of the resulting VICTOR trees are scaled in terms of the respective distance formula used. (A) Phylogenomic Genome-BLAST Distance Phylogeny (GBDP) tree generated using VICTOR based on whole-genome analysis. (B) Phylogeny tree generated through GGDC web server using the DSMZ phylogeny pipeline adapted to individual gene (capsid and scaffold protein). Maximum-likelihood (ML) tree was inferred under the VT + GAMMA model and rooted by midpoint-rooting. The branches are scaled in terms of the expected number of substitutions per site. The numbers above the branches are support values when larger than 60% from ML (left) and MP (right) bootstrapping. (C) Phylogeny tree generated through GGDC web server using the DSMZ phylogeny pipeline adapted to individual gene (Portal protein). Maximum-likelihood (ML) tree was inferred under the JTT + GAMMA model with other settings kept same as depicted for capsid and scaffold protein (Figure 5B).

